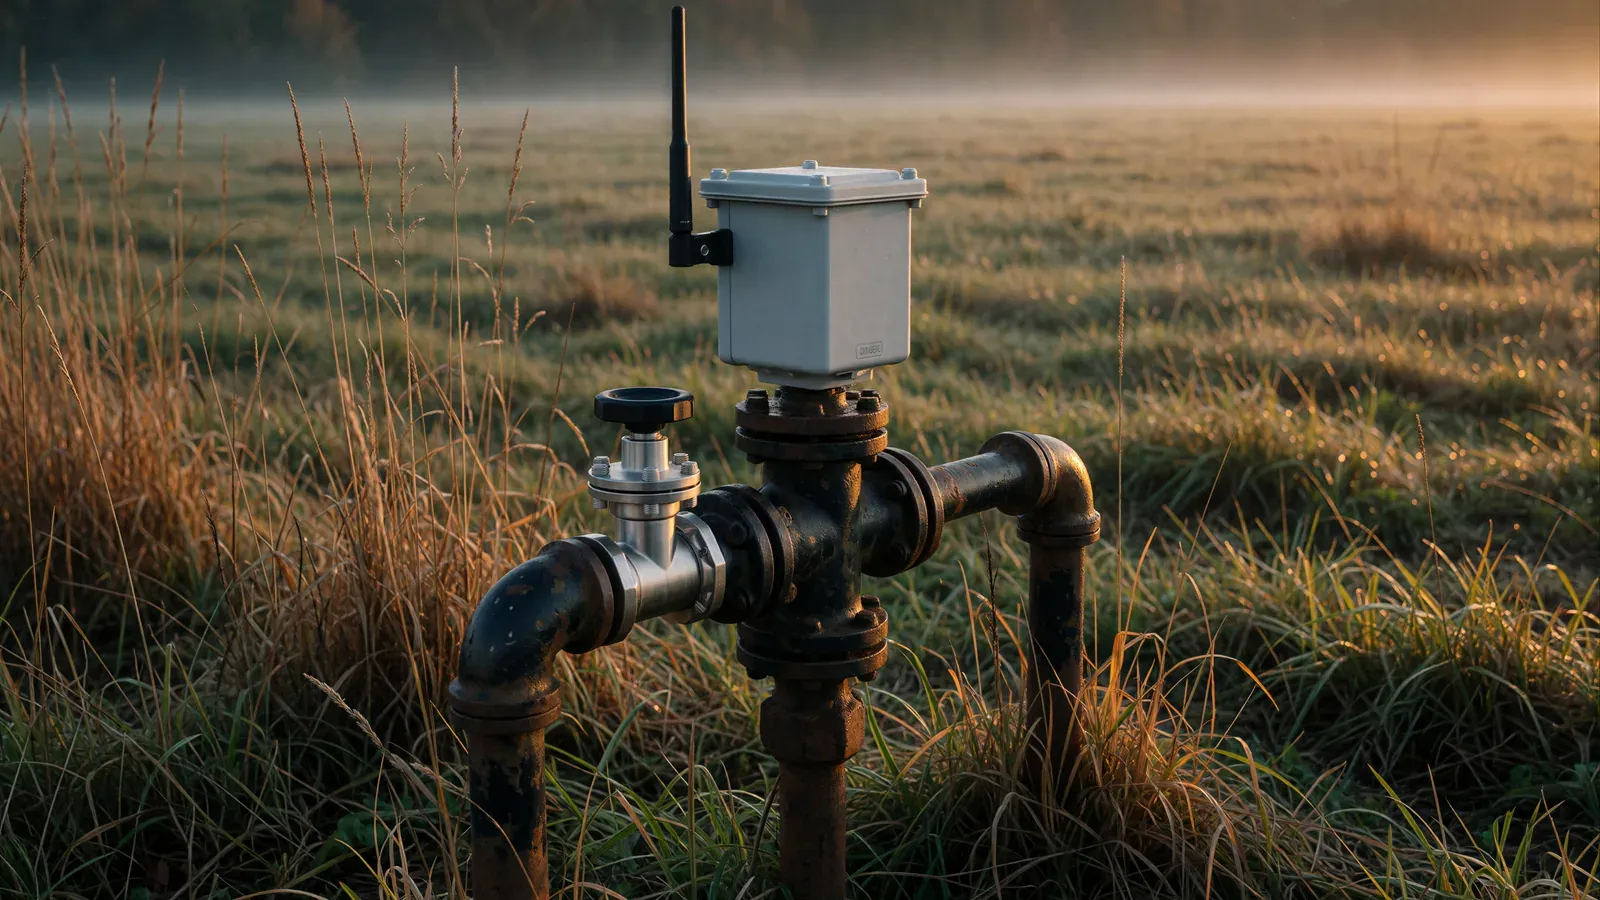
The wellhead on this farm's own natural gas well now has a pressure sensor wired into the same self-hosted stack that already reports on the cistern on this property. Every 20 minutes a LoRaWAN node reads the loop current off a pressure transmitter threaded into the gas line and reports it to Prometheus and Grafana. Seventeen days in, the trace already answers the question that mattered most: how far a hard draw pulls the well down, and how long it takes to recover.
This well produces a steady trickle rather than a strong flow, split across about six service regulators feeding loads around the farm. A large firepit pulling close to 250,000 BTU can pull the wellhead close to dry. A hard drawdown has been known to mobilize solids from the wellbore into a regulator orifice and choke it to a trickle. Knowing what the wellhead does under load is the input to every fix under discussion: a buffer volume, an inline filter ahead of the regulators, and keeping the firepit within what the well can sustain.
What you need
- A Dragino PS-LB LoRaWAN node with a TN4-A pressure probe (a 4 to 20 mA current-loop transmitter, sold under Dragino's "Hersman Pressure Transmitter" branding)
- A tee and an isolation valve on the wellhead piping to take the probe's 1/4 inch NPT thread
- A LoRaWAN gateway in range
- ChirpStack, for the network server and the device's payload codec
- MQTT, telegraf, and Prometheus, to carry a reading from ChirpStack into a dashboard
- Grafana, for the dashboard itself
This builds on the same self-hosted stack as the cistern sensor: ChirpStack, MQTT, telegraf, and Prometheus already running. If none of that exists yet, set it up first; this walkthrough is about adding a gas pressure probe to a pipeline that is already in place.
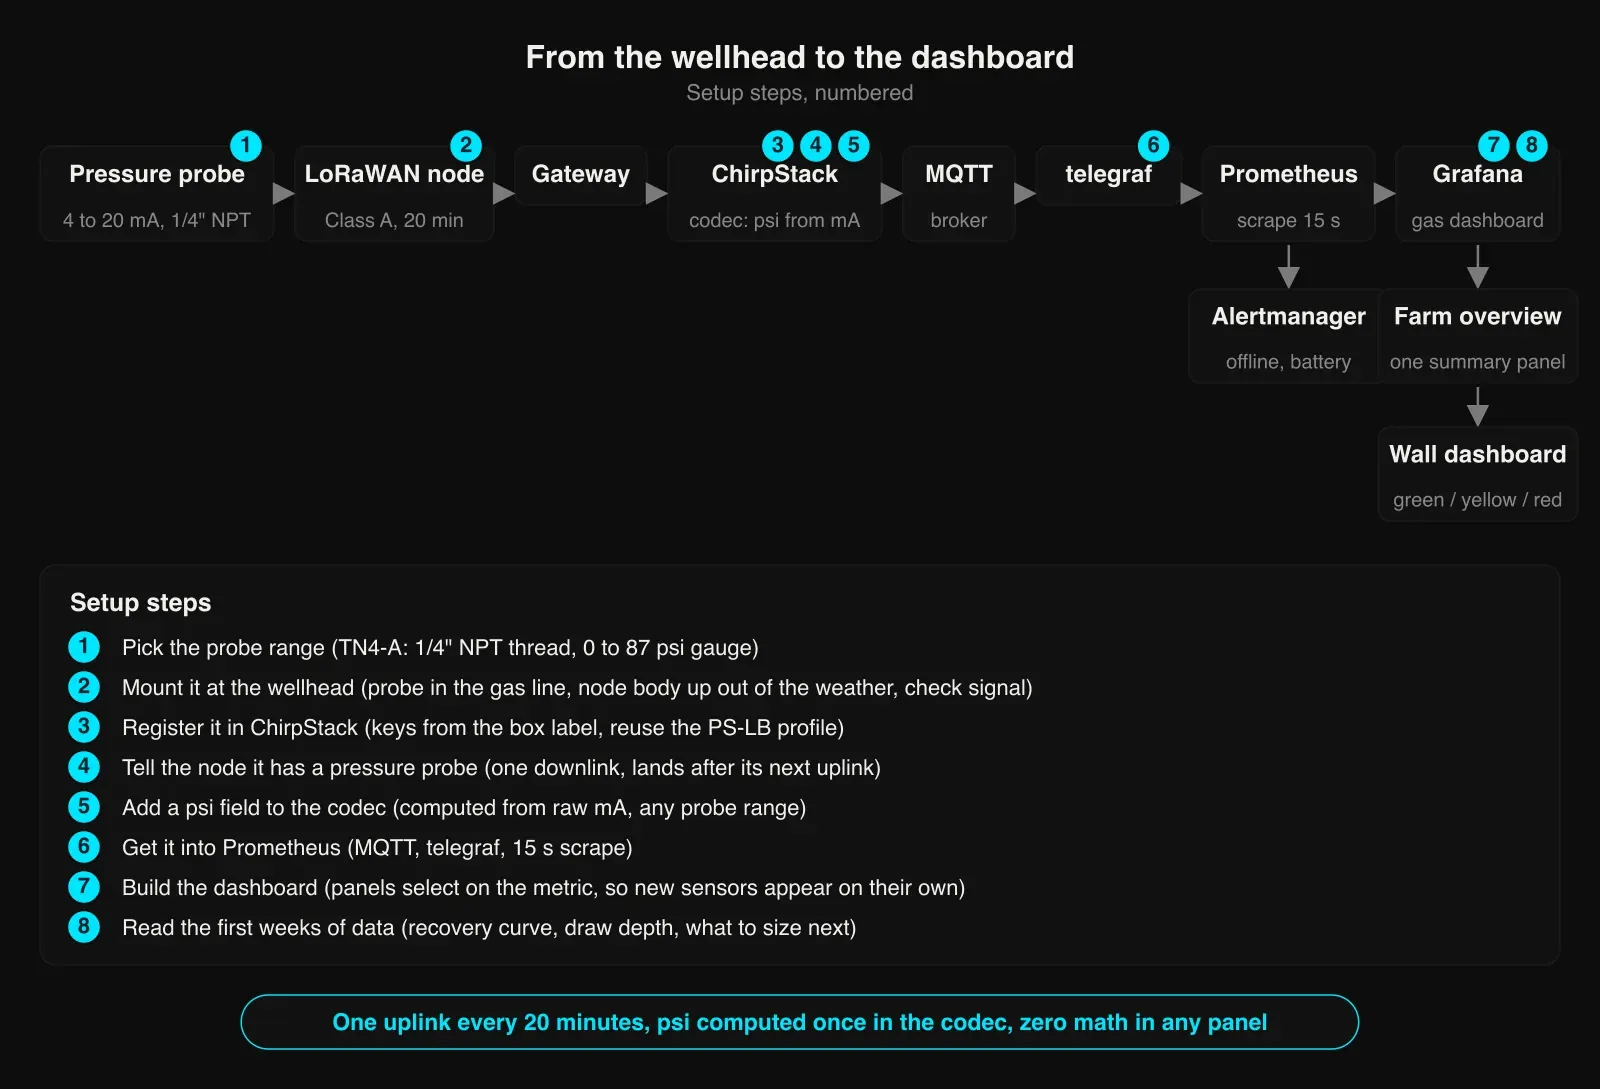
Step 1: Pick the probe range
The TN4-A probe is a thread-mount, 1/4 inch NPT, 4 to 20 mA transmitter rated 0 to 0.6 MPa, about 87 psi, at 0.2% full scale accuracy. That headroom matters more than it looks: this well's supply has historically run 10 to 40 psi, and a probe has to cover the full swing without saturating at either end.
The part number decodes simply: T marks the thread mount, N4 is 1/4 inch NPT, and the trailing letter sets the pressure range for that unit.
TIP: do not reach for the finer-resolution probes in the same family for a line like this one. TN4-J (5 kPa, about 0.73 psi) and TN4-K (7.25 psi) would pin at their maximum the moment the well built any real pressure. TN4-L (14.5 psi, about 6x finer resolution than range A) only makes sense if the line is known never to exceed roughly 14 psi, which this one is not.
Step 2: Mount it at the wellhead
The transmitter threads into a tee on a valved leg off the wellhead's knockout chamber, right under the mechanical gauge that was already there, on the supply side ahead of the regulator. It reads the well itself rather than a regulated outlet, and the gauge beside it gives a quick sanity check on the number. The node's radio body straps to a pipe beside it, off the ground, wired only to the probe.
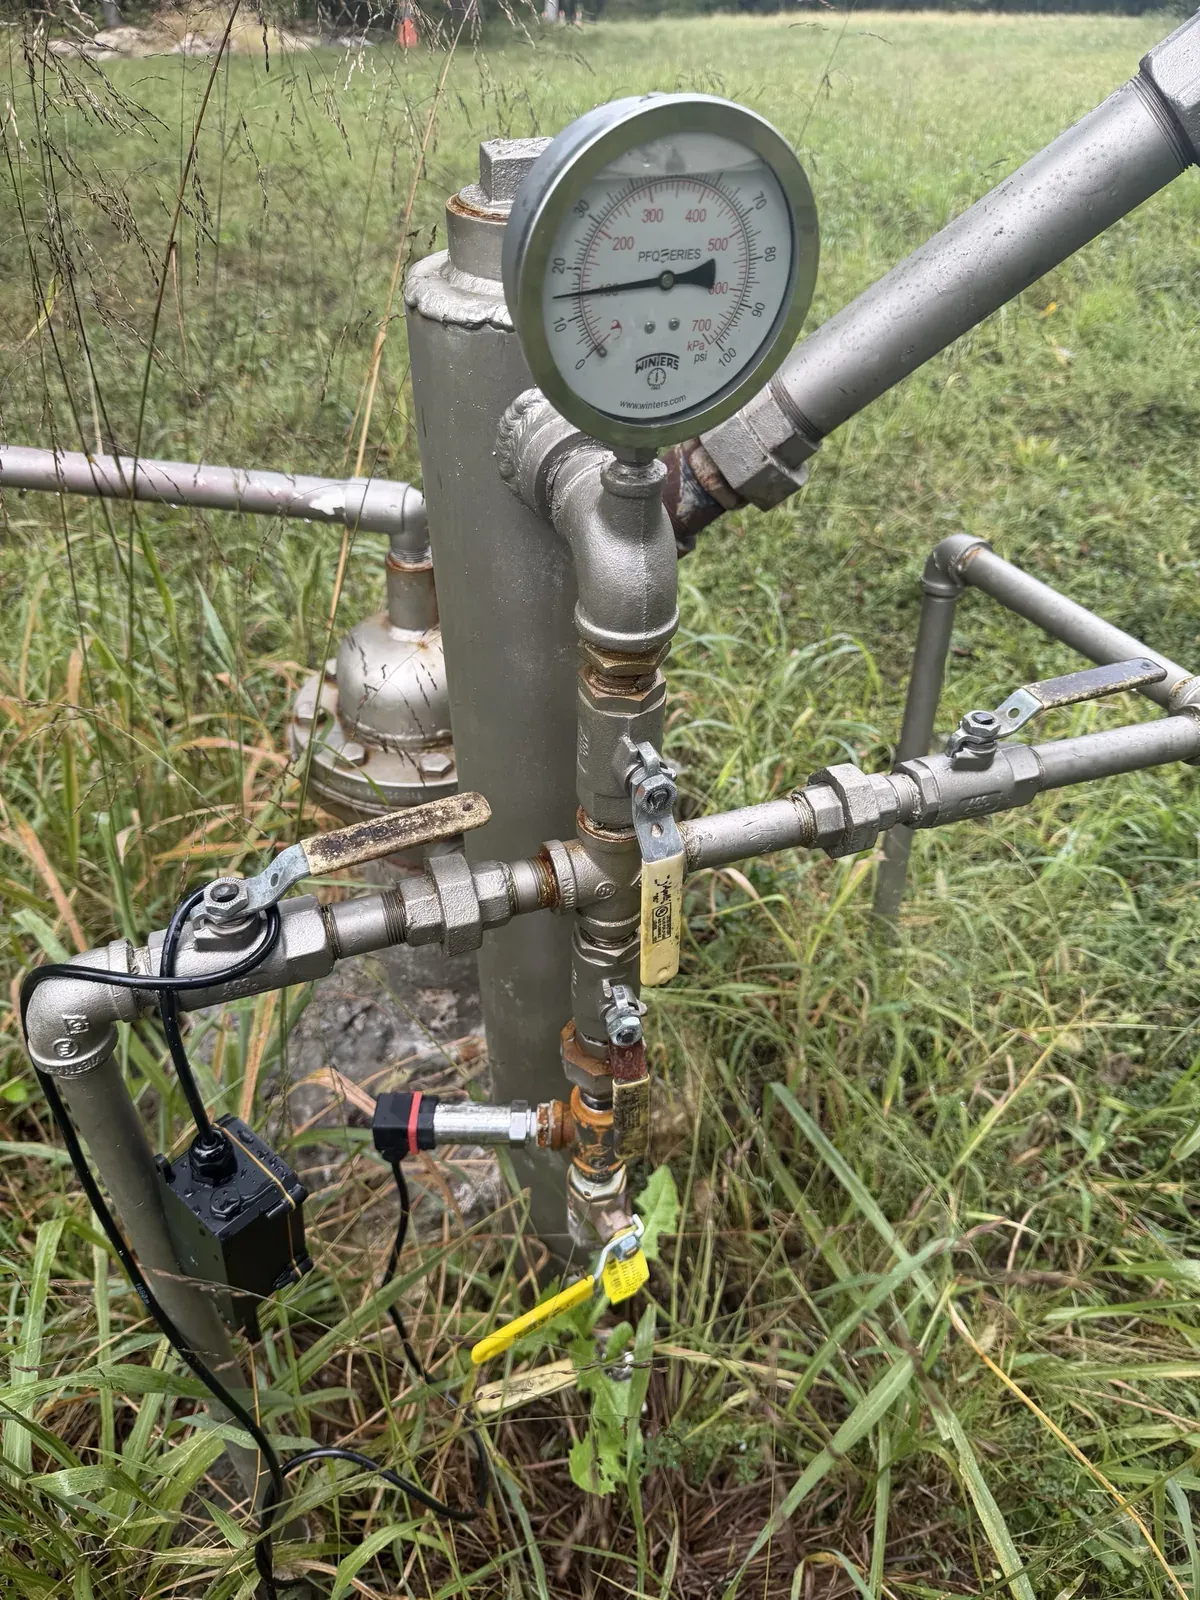
TIP: the probe has to sit on the supply side. A service regulator's outlet runs at a few inches of water column, well under 1 psi, which on an 87 psi span reads as a flat zero and looks identical to a dead sensor.
TIP: check the radio signal at the exact mount location before calling the install final. This spot reads about -69 dBm RSSI, close enough to the gateway that range was never a concern, but that is worth confirming at any new mounting site rather than assuming it.
Step 3: Register it in ChirpStack
Register the device with the DevEUI, JoinEUI, and AppKey printed on the box label, the same as any other node on this network.
TIP: for a LoRaWAN 1.0.x device, the label's AppKey goes in ChirpStack's nwkKey field, not appKey. That field is only for LoRaWAN 1.1 devices, and it is an easy pair to swap by mistake. Get it backwards and the join simply fails, with nothing on the device page to explain why.
Reuse the existing PS-LB device profile (US915, LoRaWAN 1.0.3, Class A, OTAA) instead of building a new one. The real difference between this probe and the cistern's is the probe mode, and that gets set on the device itself, not in the profile.
Watch the device's Events tab in ChirpStack for the join and the first uplink before moving on.
Step 4: Tell the node it has a pressure probe
Out of the box the node does not know what kind of probe is attached. It joined and started uplinking immediately, but every reading came back Water_deep_cm: 0, because by default it expects an immersion level probe, and there is nothing on this line for that mode to read.
The fix is a downlink, queued from the device's Queue tab in ChirpStack: the AT command AT+PROBE=0101, entered as the payload 080101 in hex (the form also takes base64, where it is CAEB) on fPort 2, with the confirmed box ticked. That sets Probe_mod to 1 (pressure) and the range byte to 01 (range A, the TN4-A). The node reboots and rejoins after applying it, and the setting persists in flash.
TIP: this is a Class A device, so the downlink only lands in the receive window that opens right after the node's next uplink. At a 20 minute reporting interval, expect to wait up to 20 minutes for it to take. A confirmed downlink stays queued until the node acknowledges it, so there is nothing to do but wait for the next uplink.
The first uplink after it lands shows the change in the raw payload: the third and fourth bytes go from 00 00 to 01 01, and the decoded fields switch from Water_deep_cm to Water_pressure_MPa. From there the uplinks carry a real pressure reading; this one went from 5.98 psi to 8.45 psi over the following 20 minutes as the well built pressure back up.
Step 5: Add a psi field to the codec
The stock ChirpStack codec computes a Water_pressure_MPa field with toFixed(3), which rounds to 0.001 MPa steps, about 0.145 psi. The node also reports the raw loop current as IDC_intput_mA, with 0.001 mA of resolution, which works out to about 0.0054 psi on a range-A probe: 27 times finer. That resolution is worth having for watching drawdown and recovery, so the codec gets a function that reads pressure straight from the raw current instead of the rounded MPa field. The codec is edited in ChirpStack under the device profile's Codec tab (payload codec: JavaScript functions). Add this function near the top of the script:
function pslb_pressure_psi(range, mA) {
  var MPA = 145.0377377, KPA = 0.1450377377;
  var k, u;
  switch (range) {
    case 1:  k = 0.0375;   u = MPA; break;  // A: 0-0.6 MPa   (87 psi)
    case 2:  k = 0.0625;   u = MPA; break;  // B: 0-1.0 MPa   (145 psi)
    case 3:  k = 0.1;      u = MPA; break;  // C: 0-1.6 MPa
    case 4:  k = 0.15625;  u = MPA; break;  // D: 0-2.5 MPa
    case 5:  k = 0.625;    u = MPA; break;  // E: 0-10 MPa
    case 6:  k = 2.5;      u = MPA; break;  // F: 0-40 MPa
    case 7:  k = 3.75;     u = MPA; break;  // G: 0-60 MPa
    case 8:  k = -0.00625; u = MPA; break;  // H: -0.1-0 MPa (vacuum)
    case 9:  return (mA <= 4.0) ? 0 :
             ((mA <= 12.0 ? (mA - 4.0) * -0.0125 : (mA - 12.0) * 0.0125) * MPA);
    case 10: k = 0.3125;   u = KPA; break;  // J: 0-5 kPa   (20 in W.C.)
    case 11: k = 3.125;    u = KPA; break;  // K: 0-50 kPa  (7.25 psi)
    case 12: k = 6.25;     u = KPA; break;  // L: 0-100 kPa (14.5 psi)
    default: return null;                   // 0 / unknown = unconfigured probe
  }
  if (mA <= 4.0) return 0;
  return (mA - 4.0) * k * u;
}
Then, inside the stock decoder's Probe_mod == 1 branch, right after it builds Water_pressure_MPa, add:
var _psi = pslb_pressure_psi(bytes[3], decode.IDC_intput_mA);
if (_psi !== null) decode.pressure_psi = parseFloat(_psi.toFixed(4));
Save the codec, then check a recent uplink's decoded payload in ChirpStack for a pressure_psi field before moving on.
The function reads the probe's range code straight from bytes[3] of the uplink, so it works for any range letter with no per-device constant, and it only runs when Probe_mod is 1, so the cistern sensor's own readings are untouched. A node that has not yet received the probe downlink reports range 0, the function returns null, and it simply emits no pressure_psi field until it is configured.
TIP: keep the codec in version control. It previously lived only inside ChirpStack's own database, and a rebuild of that database would have thrown it away with no way to get it back.
Step 6: Get it into Prometheus
Same pipeline as every other sensor on this network: ChirpStack publishes each uplink to MQTT, and telegraf turns the reading into a Prometheus metric.
[[inputs.mqtt_consumer]]
  servers = ["tcp://mosquitto:1883"]
  topics = ["application/+/device/+/event/up"]
  data_format = "json"
  tag_keys = ["deviceInfo_devEui", "deviceInfo_deviceName", "deviceInfo_applicationName"]
  name_override = "chirpstack_sensor"

[[outputs.prometheus_client]]
  listen = ":9273"
  expiration_interval = "96h"
Prometheus scrapes that endpoint every 15 seconds. The psi field lands as chirpstack_sensor_object_pressure_psi, tagged with the sensor's device EUI and device name.
Confirm the metric actually landed before building a dashboard on it: curl localhost:9273/metrics | grep pressure_psi, or run a quick Prometheus query for the metric name.
TIP: telegraf's Prometheus output only exports numeric fields and drops text fields silently, so if a codec field ever fails to show up as a metric, check its type first.
Step 7: Build the dashboard
The gas dashboard's panels all select on the metric itself, chirpstack_sensor_object_pressure_psi, rather than on a device name or ID. Only pressure-mode nodes emit that field, so the cistern sensor never shows up on it, and the moment either of the two planned regulator sensors is registered and configured, it appears on every panel automatically, with no dashboard edit.
Wellhead pressure right now:
max(last_over_time(chirpstack_sensor_object_pressure_psi{deviceInfo_devEui="<DEV_EUI>"}[3h]))24 hour rolling low:
min_over_time((max by (deviceInfo_devEui) (chirpstack_sensor_object_pressure_psi{deviceInfo_devEui="<DEV_EUI>"}))[24h:10m])Pressure change rate, psi per hour:
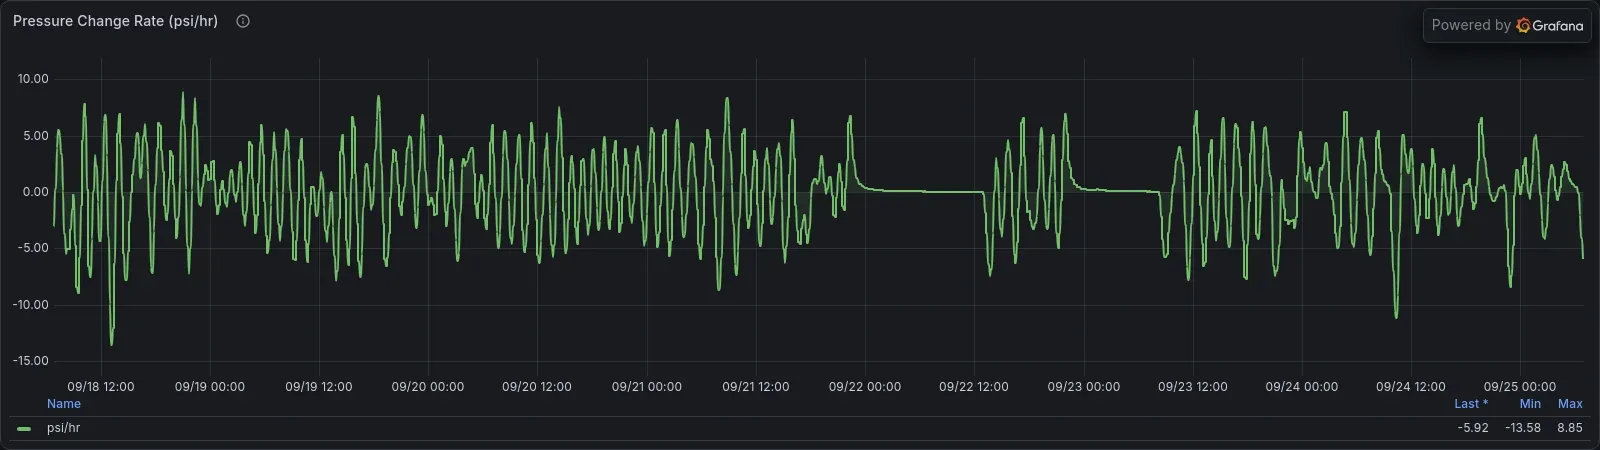
delta((max by (deviceInfo_devEui) (avg_over_time(chirpstack_sensor_object_pressure_psi{deviceInfo_devEui="<DEV_EUI>"}[30m])))[1h:10m])The dashboard has five rows:
- A headline row: current pressure per sensor, sensors reporting.
- A highs and lows row: 24 hour, 7 day, and 30 day min and max.
- A wellhead detail row: the live trace plus rolling low and high lines.
- An all-taps row for future sensors.
- A health row: battery, signal, and last uplink.
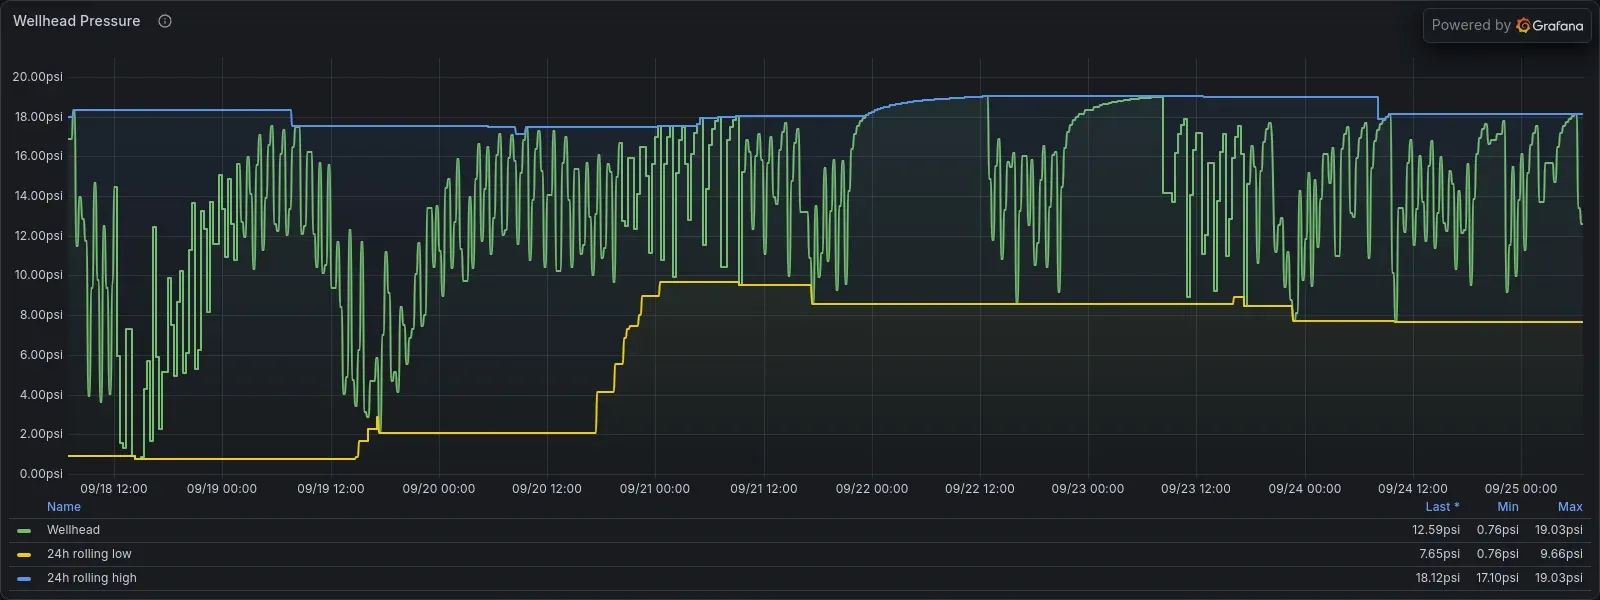
TIP: renaming a device in ChirpStack starts a second time series under the new name, since telegraf tags by device name, and a query that groups by name then hits a many-to-many join error. Group and select by the device ID instead, and join the display name back on with topk by (deviceInfo_devEui) (1, timestamp(last_over_time(metric[2d] @ end()))) * 0 + 1, which keeps one series per device and picks up its most recent name.
A one-panel summary also sits on the farm's main overview dashboard, linking through to the gas dashboard. The same reading shows up with a color band on a wall-mounted kiosk already running in the house: green at 3 psi and above, yellow between 1 and 3, red under 1 psi, roughly where the well runs dry under load.
Step 8: Read the first weeks of data
Seventeen days in, the trace is doing exactly the job it was built for.
- Current: 12.59 psi
- 17 day low: 0.02 psi
- 17 day high: 22.2 psi
- 17 day mean: 13.4 psi
- Battery: 97.2%
- Signal: -69 dBm RSSI
The daily swing is large: a draw pulls the reading under 2 psi more than once a day, and the well rebuilds toward 18 to 22 psi over the following hours when nothing is pulling on it. Over the most recent 7 days the 24 hour rolling low climbed from about 1 psi to about 7.7 psi, while the rolling high held steady in the 17 to 19 psi range.
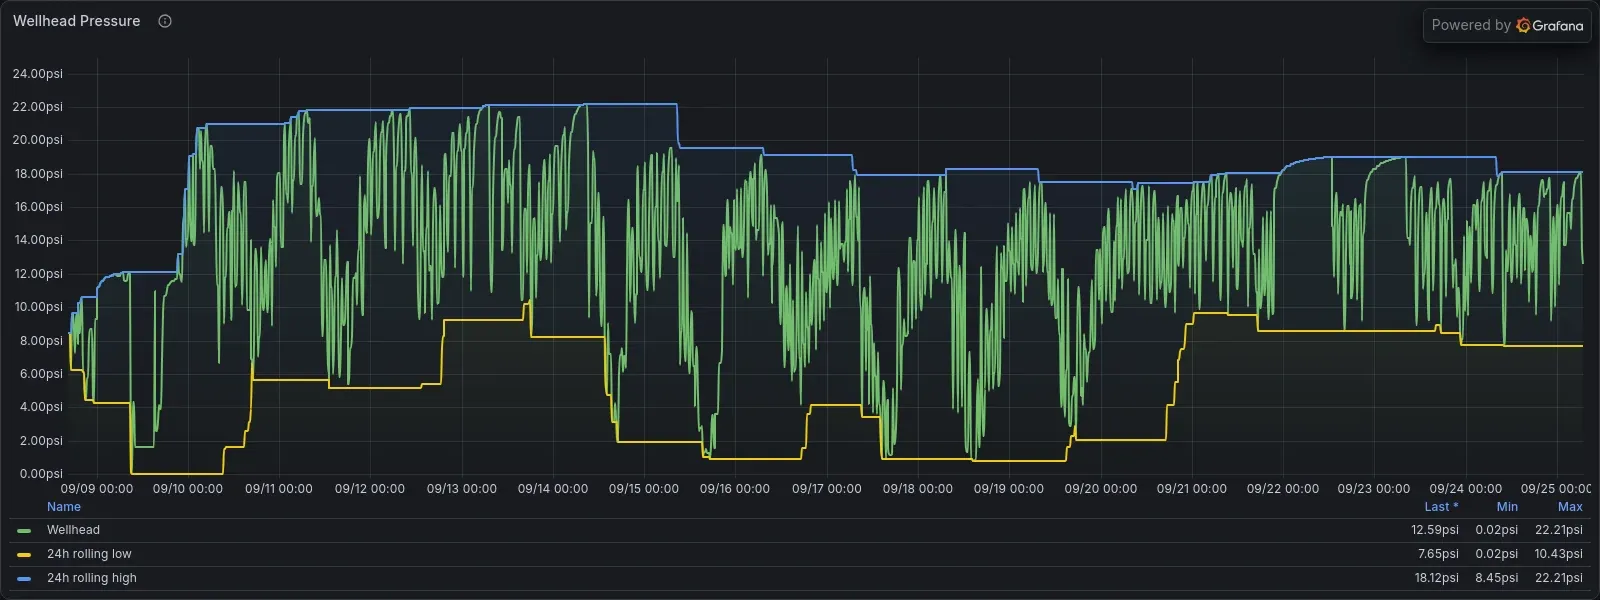
The earlier working figure for this well's supply was 10 to 40 psi. The sensor shows it spends a lot of its time lower than that, and the mechanical gauge on the same leg makes that easy to sanity check. The shape of the data is the useful part regardless: how far a draw pulls the well down and how long recovery takes is what sizes a buffer volume, decides whether an inline filter ahead of the regulators is worth adding, and sets a real limit on the firepit.
Two more of the same sensor are planned next, at the shop regulator's inlet and the house regulator's inlet, both reading supply-side pressure rather than outlet. Because the dashboard selects on the metric rather than the device, both will show up on every panel the moment they join, with no changes needed. There is no gas-specific low-pressure alert yet; the network's existing offline rule already covers this sensor, since it keys on the same raw current field and alerts to Slack if the frame counter stops moving for two hours, and the existing battery alerts cover it too. A dedicated low-pressure page is a reasonable next step once the regulator-inlet sensors are in and the normal band for each location is known.
Comments
// Comments are reviewed before appearing. No spam. No noise.