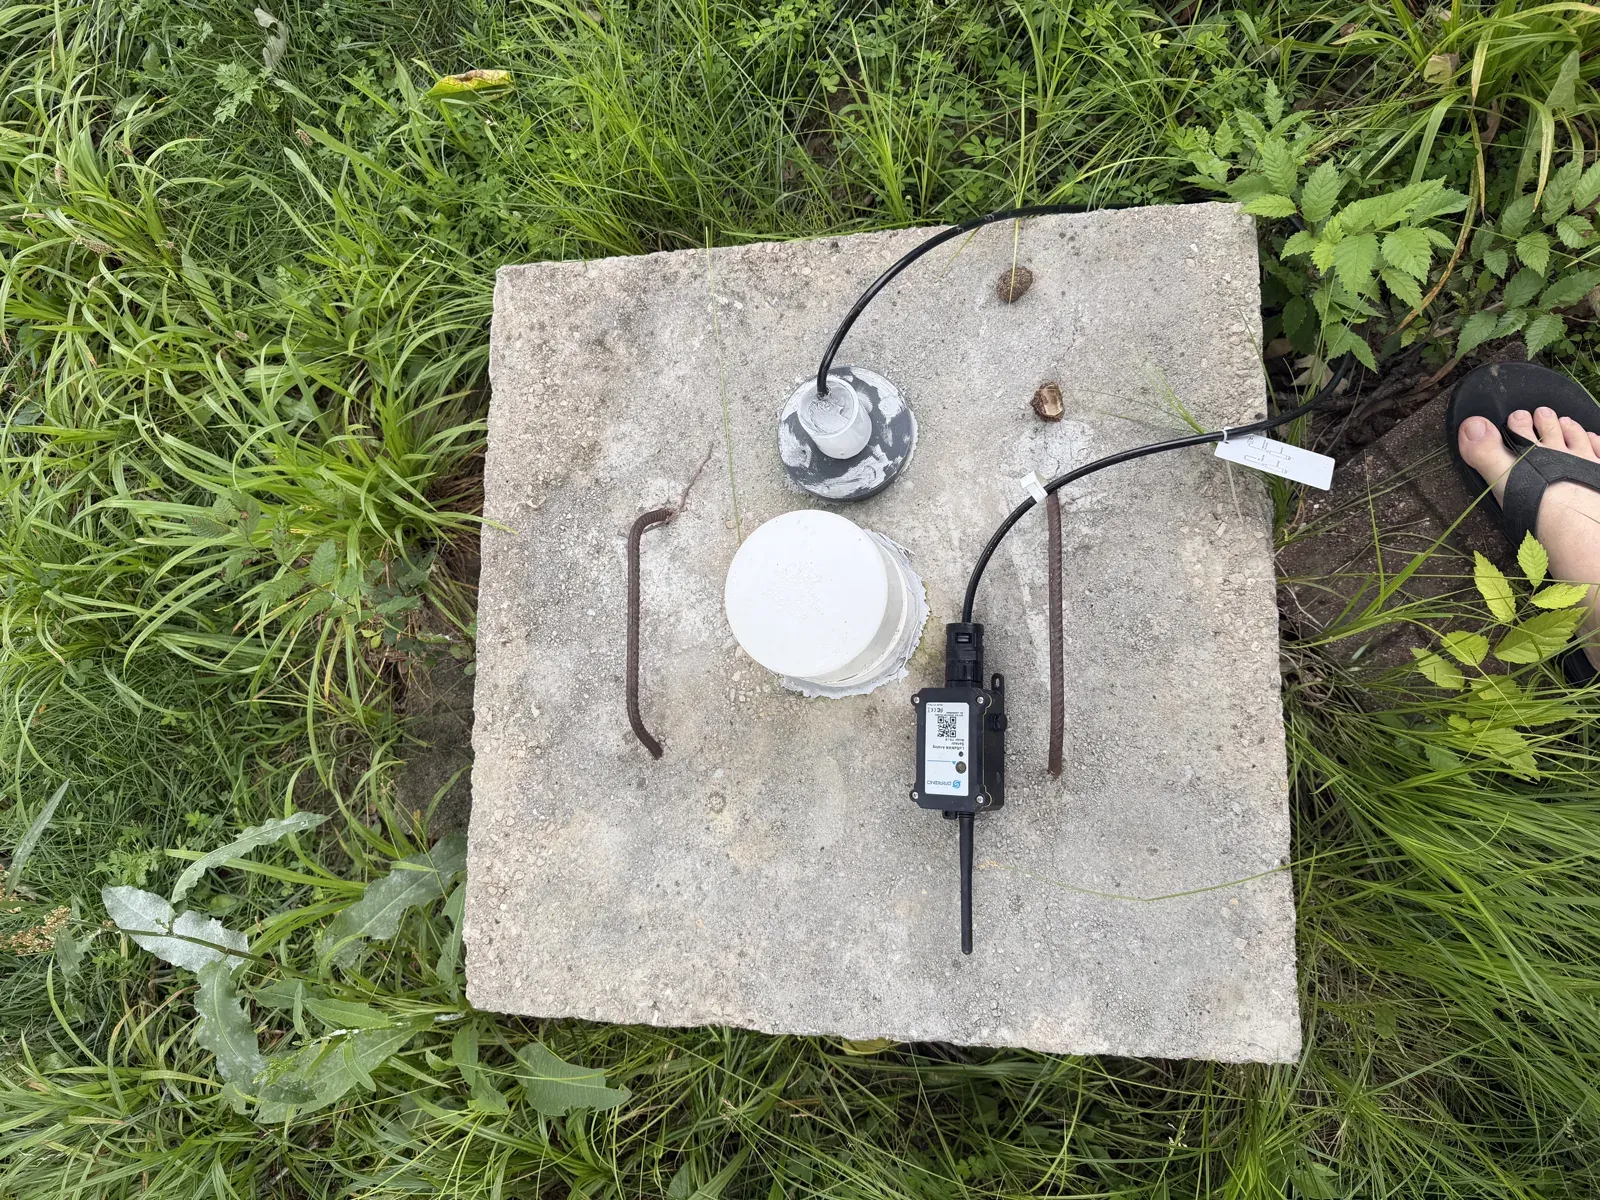
The cistern holds about fourteen hundred gallons, sits underground and outside, and the whole house runs off it. It is not on a meter and it does not announce itself. Checking it meant going out, heaving the lid off a buried tank, and looking down into the dark, which tells you "lots" or "not much" and nothing useful in between. Usage is not steady: a long shower, a load of laundry, a few days of watering, and the level drops faster than you would guess.
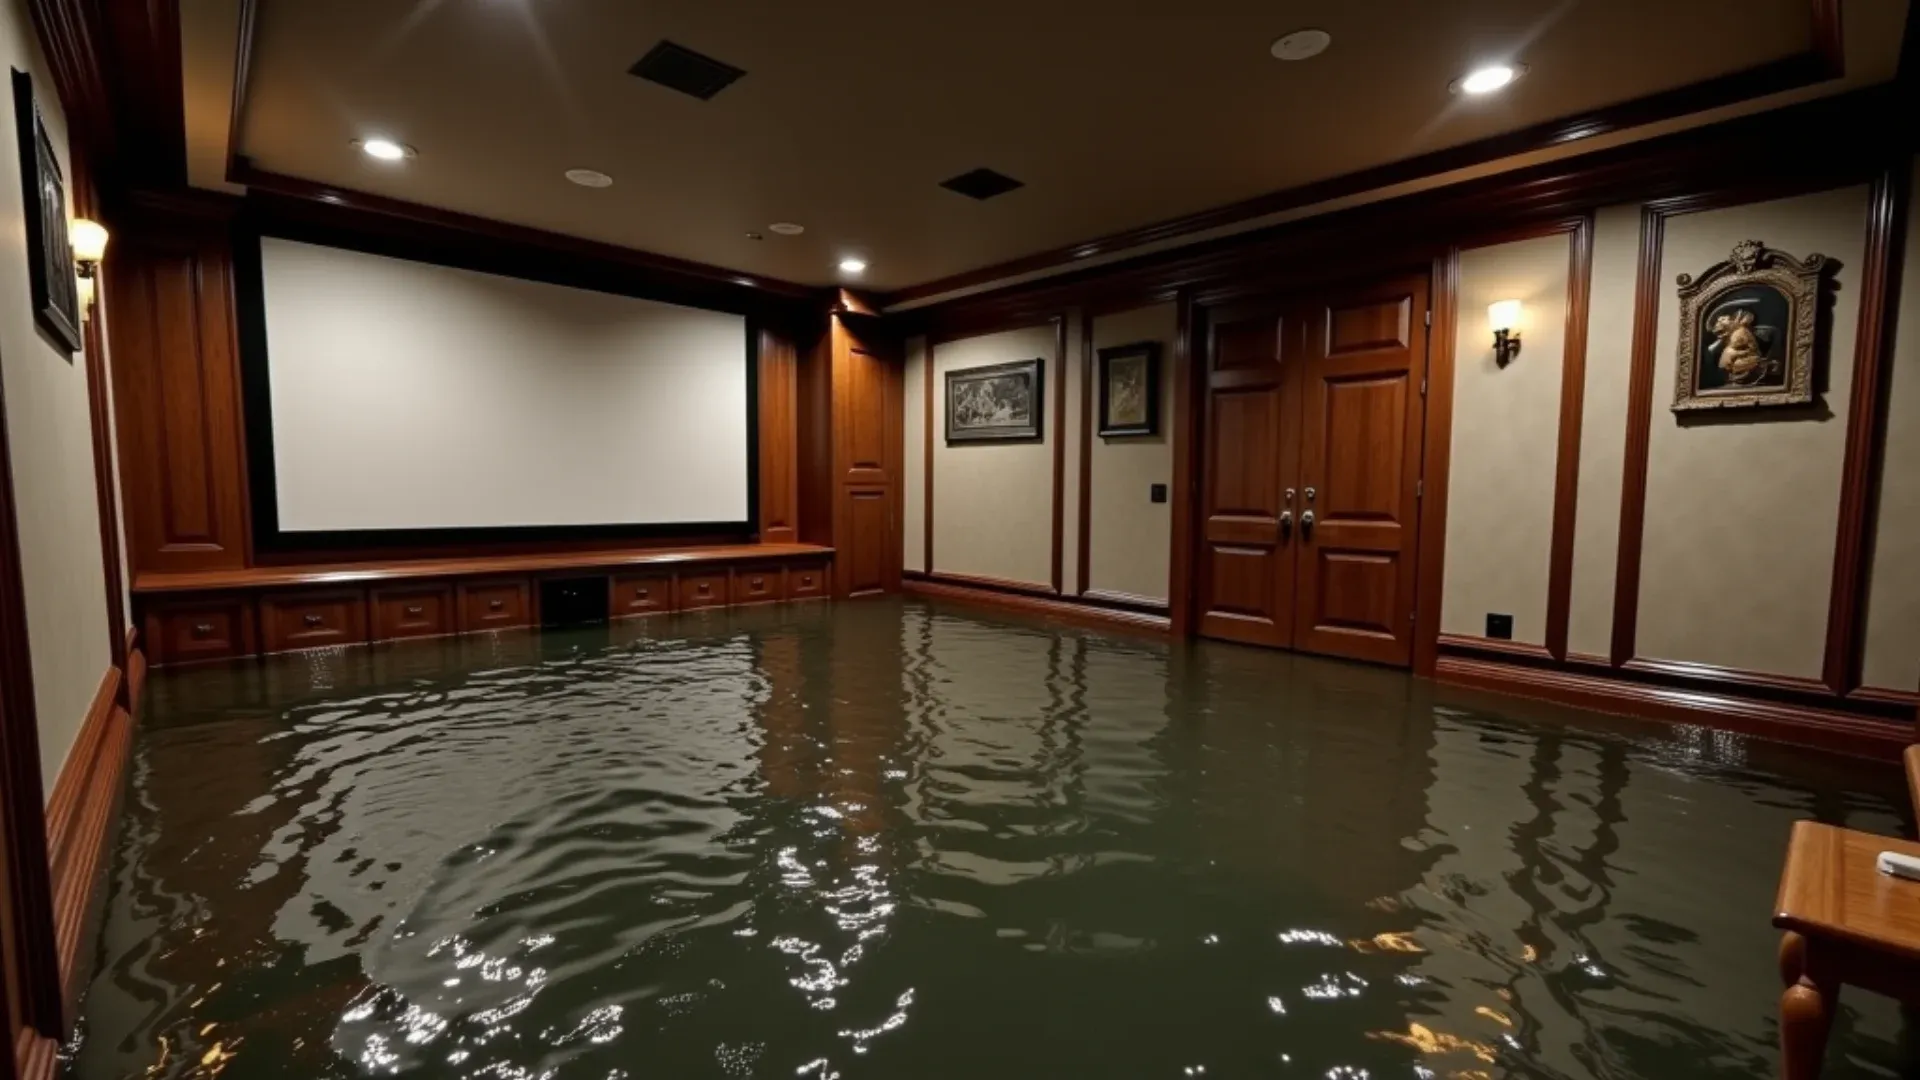
Running dry is not a minor inconvenience. No showers, no laundry, no dishes is the small version. The expensive version is the pump. Even with overdraw and dry-run protection, a pump that loses its water can boil itself, and that heat can melt the PVC on its outlet. Once that pipe lets go, every gallon standing in the plumbing of the floors above drains straight down into the basement. A dry tank does not just cost a shower. It can cost a seven-hundred-dollar pump and a flooded house. I had replaced that pump twice in as many months. There was not going to be a third.
What I wanted was boring and specific. One number, gallons remaining, somewhere I could glance at it without going outside. And once it was a number a computer could see, I wanted the rest for free: how fast we are drawing it down, how many days that leaves, and a warning before it gets low rather than after.
This is the same instinct behind wiring my whole network into one dashboard: most things that matter already produce a reading, and the work is just getting it somewhere I keep it and can act on. There the readings were already on screen. Here there was no reading at all yet. I had to put a sensor in the water first.
The chain, in words
Here is the whole journey before we walk it stage by stage:
- Water depth presses on a submersible pressure transducer at the bottom of the cistern.
- The transducer turns that pressure into a 4-20 milliamp current.
- A Dragino PS-LB LoRaWAN node reads the current and radios it across the property.
- A RAK gateway hears the packet and forwards it to my server.
- ChirpStack, a self-hosted LoRaWAN network server, decodes the packet and republishes the reading on an MQTT message bus.
- Telegraf subscribes to that bus and exposes each reading as a Prometheus metric.
- Prometheus scrapes and stores it as history.
- Grafana turns the raw current into gallons with a calibration formula and draws the dashboard.
Eight stations, physics in and a number out. The same path then carries a second water tank plus door, battery, and signal sensors with nothing new built. That reuse is the point: once the pipeline exists, every new sensor is mostly a calibration question.
Stage 1: the hardware
Three pieces do the field work, all off the shelf:
- The probe: a 4-20mA submersible pressure transducer. A sealed stainless slug on a long cable that you lower to the tank floor. The water above presses down and it converts that pressure into an electrical signal.
- The node: a Dragino PS-LB. Dragino's analog-input LoRaWAN node, built to take a 4-20mA (or 0-20mA) loop on a screw terminal, sample it, and transmit over LoRaWAN. Its battery lasts years, not months, because it wakes, reads, sends one tiny packet, and sleeps. My live device is named Dragino Water Level Sensor PS-LB (Cistern); the board inside is silkscreened
DT4SL V2.0and speaks the standard PS-LB payload, so I register it with the PS-LB codec. It knows nothing about water; it knows how to read a current and send it. - The gateway: a RAK Wireless LoRaWAN gateway. The radio base station, and the one piece you buy only once. Mine sits indoors in a shop a good distance from the house, and it still hears a sensor sealed inside a buried tank clear across the property. That is the whole point of LoRaWAN: long range at a tiny bitrate, so one gateway covers the entire place and every sensor on it at the same time. Confirm your exact model from the gateway label or your network server's gateway page.
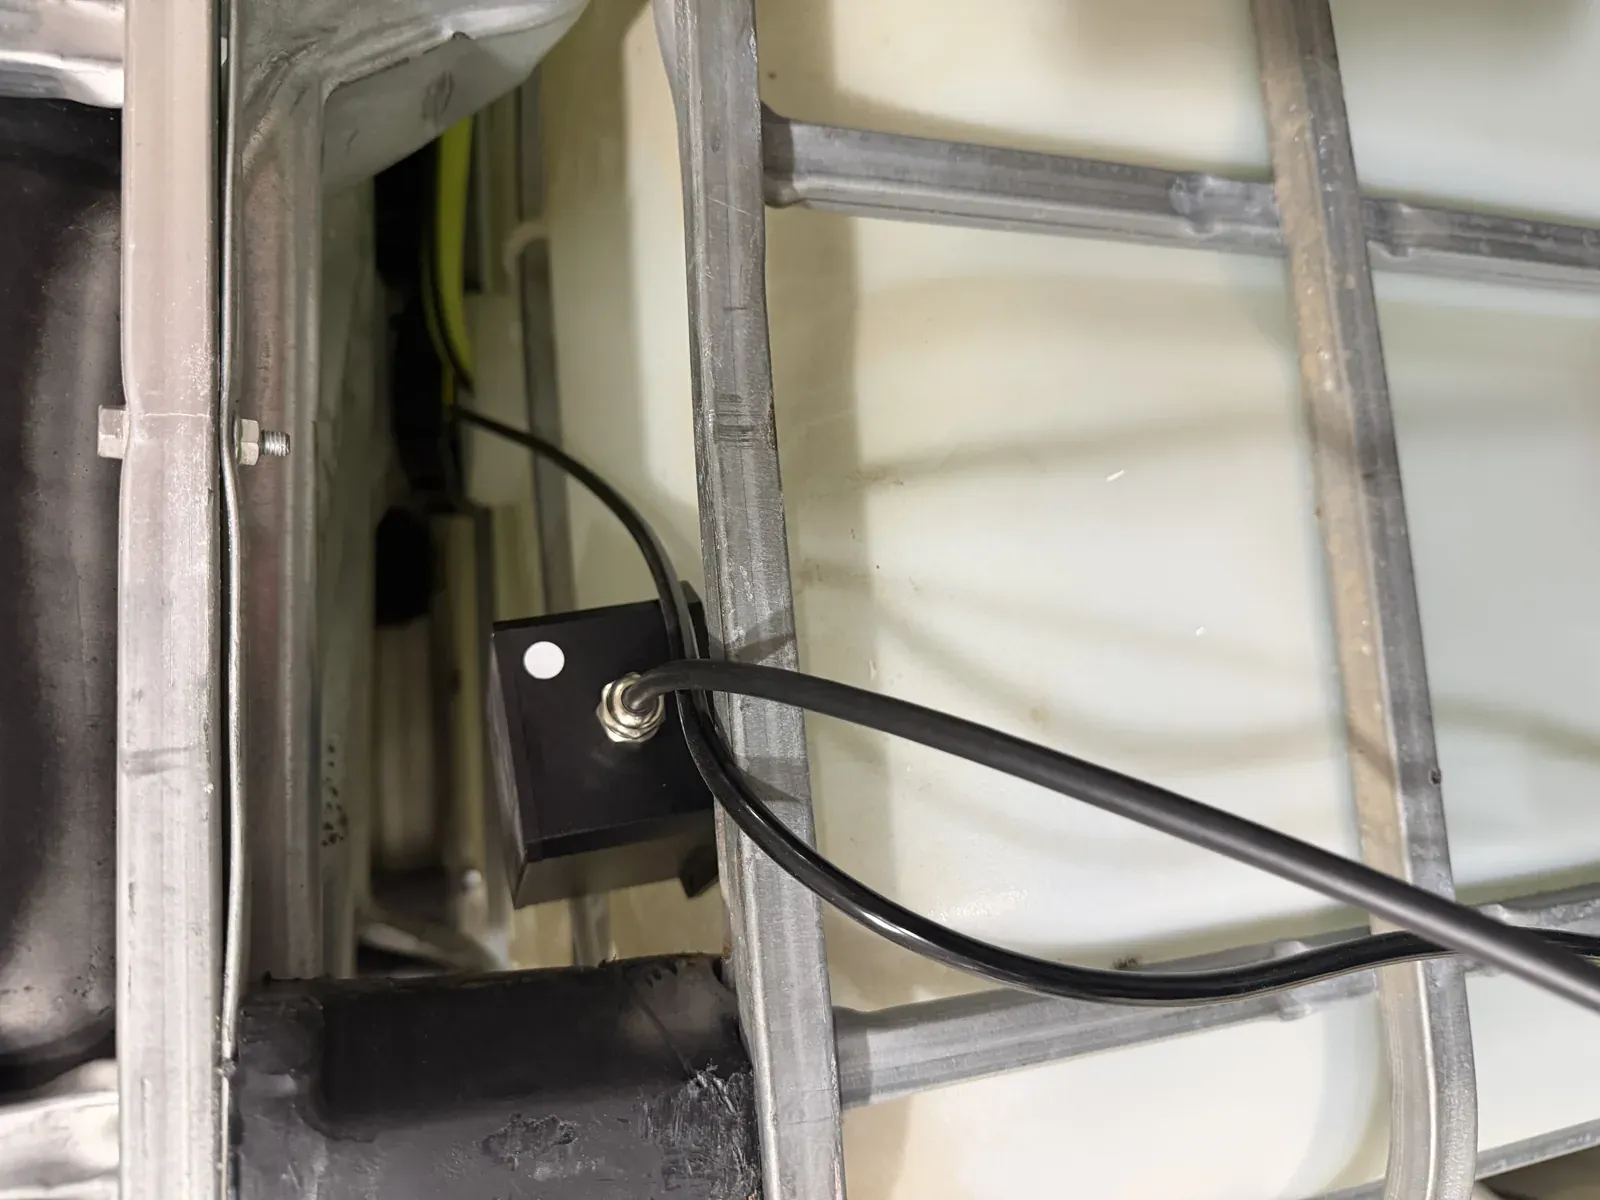
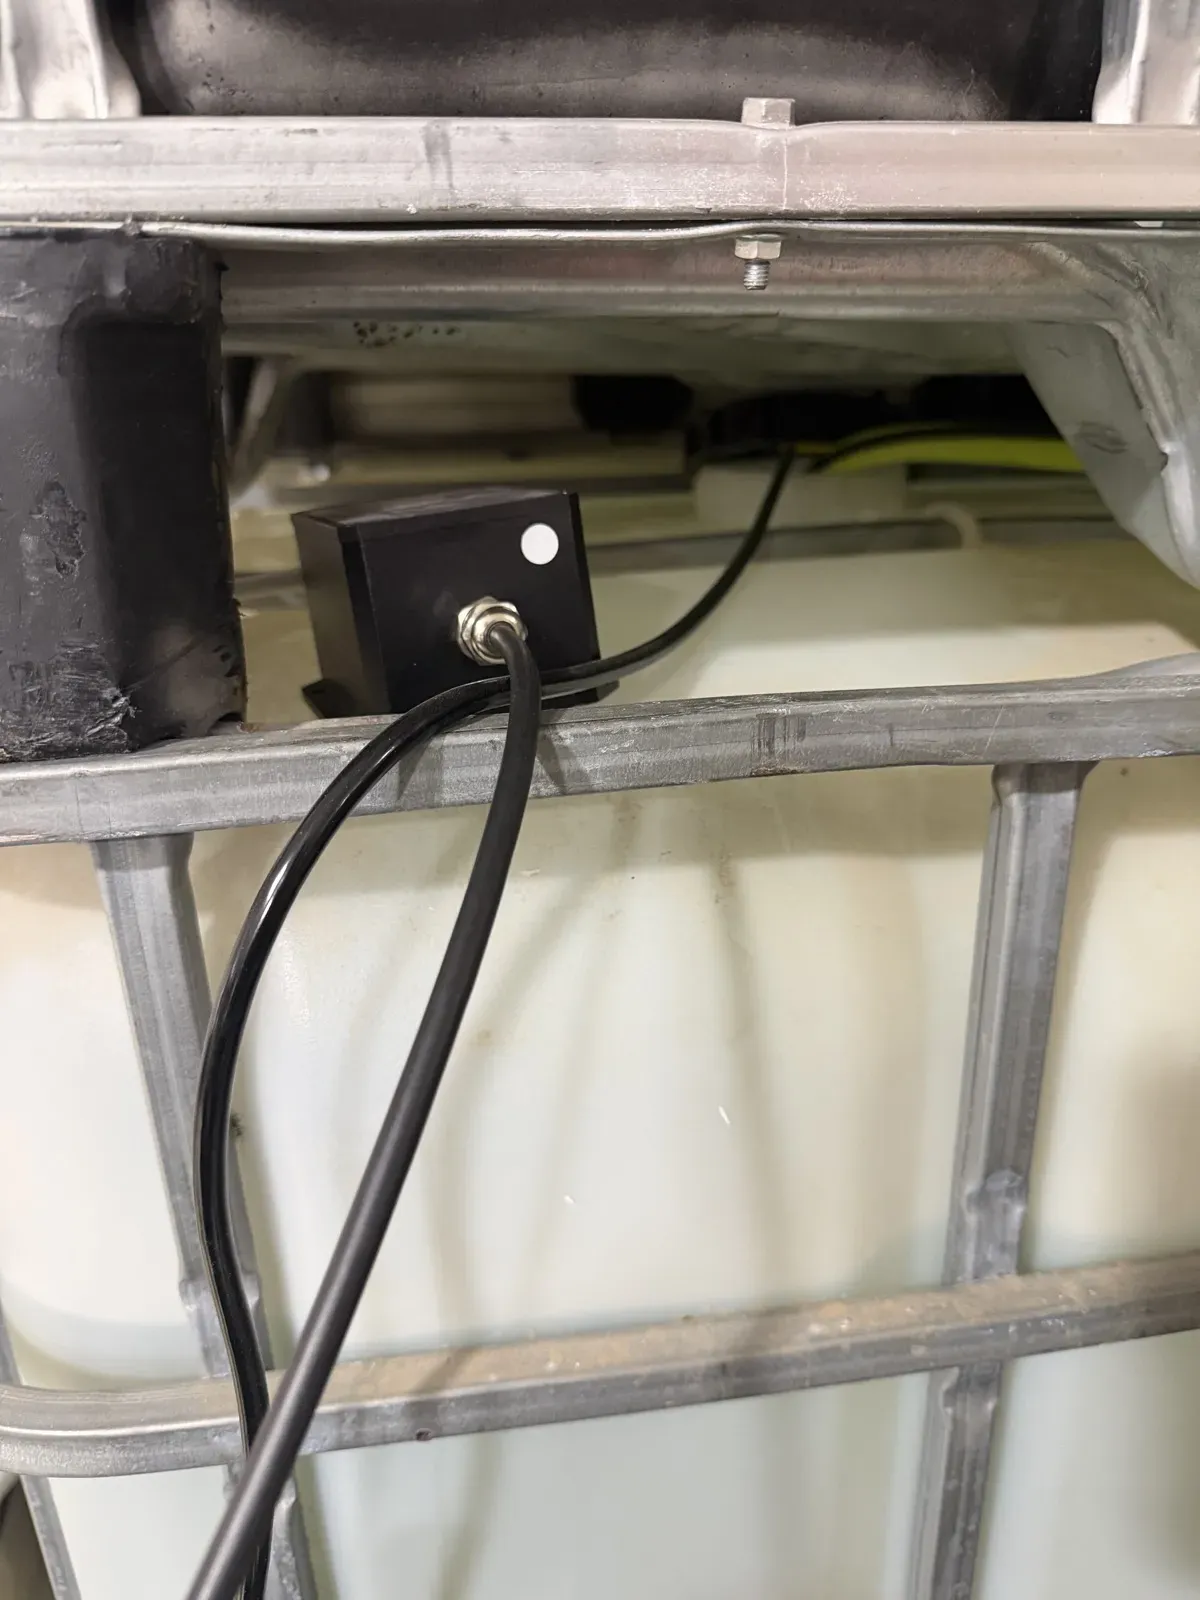
There is a second water sensor too, which I bring in near the end because it proves the pipeline generalizes: a Rejeee SL711 watching two daisy-chained IBC totes at the shop. Same gateway, same server, same dashboard. For now, just note it rides the same pipeline.
Why LoRaWAN rather than WiFi: the cistern is buried, outside, far from an outlet, and nowhere near WiFi. WiFi sensors want mains power and a strong access point, and they burn through batteries in weeks. A LoRaWAN node sips so little power that one battery lasts years, and it reaches a gateway in another building through walls and across acres because it trades bitrate for range. For "tell me a number every few minutes from somewhere with no power and no WiFi," nothing else comes close.
Stage 2: wiring the transducer to the node
This is the only step with a screwdriver, and it is simple. A 4-20mA transducer is a two-wire loop device: it needs power fed through it, and the same two wires carry the signal as the current the loop draws. The job is to put the node's analog input in series with the probe.
- Open the node. The PS-LB has a sealed enclosure with a screw-down lid. Inside are the battery and a labeled terminal block.
- Find the loop terminals. Dragino labels them for the analog input: a power-out pin to feed the transducer and an input pin to read the loop. Match the transducer's two leads per the PS-LB's own label.
- Set the input mode. Put the input in 4-20mA current mode (a jumper or a downlink config depending on firmware) so it reads the loop as a current, not a voltage.
- Lower the probe. Feed the cable down through the lid or riser so the transducer rests at the tank floor, with the radio and battery up top where they stay dry. Seal the gland so nothing wicks down the cable.
- Close it up. Once it joins (next stage) you should see a current value land well above 4mA when there is water in the tank.
Confirm the terminal labels against your node's manual; they differ slightly across Dragino's analog models.
Why 4-20mA and not a voltage
This is the reason the reading is trustworthy down a long submersible cable. A 4-20mA sensor does not hand you a voltage. It acts as a current regulator: it forces a specific current, between 4 and 20 milliamps, through the loop and holds it no matter the wire resistance. The node measures the current. Three things fall out:
- Live zero. Empty is 4mA, not 0mA, so a genuine 0mA reading is unambiguously a fault: broken wire, dead probe, no power. You can tell "empty tank" from "dead sensor," which a 0-based signal never can. That is the whole reason 4-20 beats 0-20.
- Immune to cable length. Because the loop holds the current constant, voltage drop down a long cable does not change the reading.
- Noise immunity. Current loops shrug off induced electrical noise far better than a low-level voltage signal.
So the physical story is: water depth makes hydrostatic pressure, pressure is linear in depth, the transducer turns pressure into a 4-20mA current, and the PS-LB radios it out. Every link is linear, which is why the calibration at the end is a single straight line. Say the tank is around three-quarters full and the loop is near 7.83 mA. That is our reading. Follow it.
Stage 3: standing up ChirpStack and adding the gateway
The packet now needs somewhere to land. That is the job of a LoRaWAN network server, and I run mine myself: ChirpStack, on the same home NAS that hosts the rest of my monitoring. The server holds the decoded readings and the device keys, and I would rather that sit on a box in my own rack than in a cloud I rent by the device. Same "keep the data on my own box" approach as the rest of my telemetry.
The easiest way to stand it up is the official Docker bundle. The upstream chirpstack/chirpstack-docker repo gives you everything in one compose file: ChirpStack, Postgres, Redis, an MQTT broker (Mosquitto), and the gateway bridge.
git clone https://github.com/chirpstack/chirpstack-docker.git
cd chirpstack-docker
docker compose up -d
That brings up the web UI on port 8080. The one setting that matters up front is your region. I am in the US, so everything is US915. The Basics Station gateway bridge config sets the region and listens for the gateway on port 3001.
# configuration/chirpstack-gateway-bridge/chirpstack-gateway-bridge-basicstation-us915_0.toml
[backend]
type = "basic_station"

  [backend.basic_station]
  bind = ":3001"
  region = "US915"
Heads-up if you clone the upstream repo: it ships with some EU868 leftovers in the default compose env and command flags. Those are upstream defaults, not your live path. The path that actually carries data is the US915 Basics Station config above. If you are in the US, point your gateway at the Basics Station endpoint on 3001 and ignore the EU868 strings.Now the gateway, in the ChirpStack UI:
- Gateways, Add gateway. Give it a name and paste its Gateway EUI, printed on the device label and shown in the gateway's own admin page.
- Point the gateway at ChirpStack. In the RAK gateway's web admin, set the network server to Basics Station mode and aim it at your server on port
3001. Put the gateway somewhere central with power and ethernet. Mine lives indoors in a shop and still covers the whole property, because LoRaWAN does not need the clear line of sight that higher-frequency radios do, so an indoor mount in an outbuilding is fine. - Watch it come online. Within a minute the gateway shows "last seen" ticking in the UI. Nothing is decoded yet, but the ears are on.
Stage 4: registering the node and decoding its payload
The gateway hears every nearby radio, but ChirpStack only does something useful with a packet if it recognizes the device. So you register the node.
LoRaWAN devices join with OTAA (over-the-air activation), a handshake using three values that must match between node and server: a DevEUI (the node's unique hardware ID, on its label, usually as a QR code), a JoinEUI (also called AppEUI), and an AppKey (the secret root key).
- Device profiles, Add. Make a profile for the PS-LB: region US915, OTAA, LoRaWAN version per the node's spec.
- Applications, Add, then add a device under it. I called mine Homestead Application. Paste the DevEUI from the node label (mine is
a84041d0f55c536d, and thea84041prefix is Dragino's). - Enter the JoinEUI and AppKey. These come with the node or are set via Dragino's config tool. If you are following along, these are your values, off your device.
- Power the node. It joins, the uplink counter climbs, and raw frames arrive in the Live frames tab.
Raw frames are still just bytes. The last piece is the payload codec: a small JavaScript function on the device profile that turns bytes into named fields. Dragino publishes the PS-LB codec; paste it into the device profile's Codec tab. For the cistern node it emits:
IDC_intput_mA, the loop current in milliamps. Note the spelling:intputis Dragino's literal typo, and it flows through the whole pipeline unchanged, so every downstream metric name carries it too. Do not "fix" it.VDC_intput_V, the input voltage.Water_deep_cm, a depth the node computes itself.Probe_mod, the probe mode.Bat_V, the node's battery voltage, around3.588 Von mine.
IDC_intput_mA is the one that matters. Once the codec is in, the decoded view shows a clean object, and our reading reads object.IDC_intput_mA: 7.83. The bytes have become a labeled number.
The codec lives in ChirpStack's database, not a file on disk, so copy yours out of the UI for backup. And while you are in the configs, harden the placeholder API secret and net-id the upstream image ships with: fine on a closed LAN, but defaults, not settings.
Stage 5: Telegraf, from the message bus to Prometheus
ChirpStack now publishes every decoded uplink as JSON onto the Mosquitto bus, on a topic like application/{ApplicationID}/device/{DevEUI}/event/up. That is great for reacting in real time, but it is a message flying past, not history, and Prometheus does not speak MQTT. So I put Telegraf in the middle: it subscribes to the MQTT topics, flattens each uplink into metrics, and exposes them on an HTTP endpoint Prometheus can scrape. The whole bridge is one short config, in a telegraf:1.30 container next to ChirpStack:
[agent]
  interval = "10s"
  round_interval = true
  metric_batch_size = 1000
  metric_buffer_limit = 10000
  collection_jitter = "0s"
  flush_interval = "10s"
  flush_jitter = "0s"
  precision = ""
  hostname = "chirpstack-telegraf"
  omit_hostname = true

[[inputs.mqtt_consumer]]
  servers = ["tcp://mosquitto:1883"]
  topics = ["application/+/device/+/event/up",
    "application/+/device/+/event/status"
  ]
  qos = 0
  connection_timeout = "30s"
  persistent_session = false
  client_id = "telegraf-mqtt"
  data_format = "json"
  tag_keys = ["deviceInfo_devEui", "deviceInfo_deviceName", "deviceInfo_applicationName"]
  name_override = "chirpstack_sensor"
  tagexclude = ["data", "topic", "host"]

[[outputs.prometheus_client]]
  listen = ":9273"
  path = "/metrics"
  expiration_interval = "25h"
  metric_version = 2
The trick is the plain data_format = "json" parser. It walks every nested path in the uplink JSON and flattens it with an underscore, and name_override prefixes the lot with chirpstack_sensor. So:
object.IDC_intput_mAbecomeschirpstack_sensor_object_IDC_intput_mArxInfo[0].rssibecomeschirpstack_sensor_rxInfo_0_rssideviceInfo.devEuibecomes the labeldeviceInfo_devEui
That last one is how every device ends up on the same metric name, told apart by the deviceInfo_devEui label. No per-field mapping to maintain. This is the plain json parser, not json_v2. Two details worth copying:
tagexclude = ["data", "topic", "host"]drops the raw base64 payload, the MQTT topic, and the hostname so they do not become high-cardinality labels.expiration_interval = "25h"means a sensor that has not uplinked in under a day still shows its last value, which is why the "is this sensor online" check downstream reads the metric's timestamp over a two-hour window rather than waiting for the series to vanish.
The matching half lives in Prometheus, scraping Telegraf on port 9273:
# prometheus.yml
  - job_name: 'telegraf-lorawan'
    static_configs:
      - targets: ['192.168.1.2:9273']
    metric_relabel_configs:
      # Drop any stray `data` label so all points collapse into one series
      - regex: data
        action: labeldrop
That is the whole path from radio to time-series database. Our reading is now a stored point, chirpstack_sensor_object_IDC_intput_mA{deviceInfo_devEui="a84041d0f55c536d"} = 7.83, kept as long as I have disk.
One quiet number, decoded by a server I host, parked in a database I own. From here on it is just math.
Stage 6: calibration, turning milliamps into gallons
The reading is in Prometheus as a current; the cistern speaks gallons. Because the chain is linear, the conversion is a single straight line:
gallons = IDC_intput_mA * 350.493 - 1699.89I got those constants with a two-point calibration: read the current at a known low level, again at a known high level, fit a line. Solving it back out is a good sanity check:
# current at 0 gallons (empty)
mA = 1699.89 / 350.493 = 4.850 mA

# current at 1400 gallons (full)
mA = (1400 + 1699.89) / 350.493 = 8.844 mA
Both numbers are physically coherent, which is how you know the calibration is sound. The empty intercept lands at 4.850 mA, just above the transducer's 4 mA live-zero, which is right: the pump's empty point sits a little above the true bottom of the tank, not at the probe's dead zero. Full is 8.844 mA, so the tank uses only about 4mA of the sensor's 16mA span: the transducer is over-ranged for a tank this shallow, which is fine, just a little coarse on resolution. The slope of 350.493 gallons per milliamp comes out to the right fourteen hundred over the working span.
Live check at the time of writing: the probe read 7.825 mA, which the formula turns into 1043 gallons, about three-quarters full. That sits comfortably inside the calibrated 4.85 to 8.84 mA band, so the math is operating where it was fit, not pinned against a limit.
The actual dashboard query wraps that line in defensive armor:
clamp_max(
  clamp_min(
    min( quantile_over_time(0.5, chirpstack_sensor_object_IDC_intput_mA[15m]) ) * 350.493 - 1699.89,
    0),
  1400)
quantile_over_time(0.5, ...[15m])is the 15-minute median. Water sloshes and uplinks arrive irregularly, so any single sample can be off. A median rejects spikes far better than an average, which gets dragged by outliers.clamp_min(..., 0)floors at zero gallons so a drifting or cold reading below the empty intercept cannot go negative and poison the usage math.clamp_max(..., 1400)ceilings at capacity so an over-full blip cannot report fifteen hundred gallons in a fourteen-hundred-gallon tank.
If you ever recalibrate: draw to two known volumes, record IDC_intput_mA at each, and recompute.
slope     = (gal_high - gal_low) / (mA_high - mA_low)
intercept = gal_low - slope * mA_low
I mirror this exact PromQL in a tiny standalone page too (more below), so if the calibration changes I update both places or the two readouts disagree. And note that a clamped-to-zero fault and a genuinely empty tank both read "0 gal," so a staleness alert is a worthwhile companion (Stage 8).
Adding the SL711 shop tank: same pipeline, different math
The second water sensor is a Rejeee SL711 watching two daisy-chained IBC totes at the shop, about 330 gallons each. It rides the exact same pipeline. Adding it was registering a second device and pasting its codec. Only two things differ: the field it emits and the formula.
The SL711 is a different class of sensor. It still has a 4-20mA pressure element inside, but its firmware does the pressure-to-depth conversion on the device and transmits a finished depth in millimeters as object.level_mm (plus level_m, a raw current_mA for diagnostics, and a battery_percent rather than a battery voltage). So the cloud side never sees a loop current to calibrate. It only needs depth to volume:
gallons = 2 * (level_mm / ibc_full_depth_mm) * ibc_capacity_galWith the live dashboard variables ibc_full_depth_mm = 1015 and ibc_capacity_gal = 330:
level_mm / ibc_full_depth_mmis the fraction of one tote that is full.- Times
ibc_capacity_galgives gallons in one tote. It is linear because an IBC tote is a straight-sided cube: constant cross-section top to bottom, so volume is proportional to depth. No geometry curve, no lookup table. - The
2 *is because the two totes are plumbed together at the bottom so they equalize like communicating vessels. One sensor reads the shared level, and the pair holds up to2 * 330 = 660gallons.
The query carries the same median-and-clamp armor:
clamp_max(
  clamp_min(
    2 * (quantile_over_time(0.5, chirpstack_sensor_object_level_mm{deviceInfo_devEui="cacbb803300003e7"}[15m]) / $ibc_full_depth_mm) * $ibc_capacity_gal,
    0),
  2 * $ibc_capacity_gal)
Live check: 1045 mm gives 2 * (1045 / 1015) * 330 = 680 gallons, which clamp_max pins to 660. The raw depth slightly exceeds the configured full mark, so the clamp is doing its job. If it fires routinely, that is a hint to nudge ibc_full_depth_mm up toward the real fill line, a recalibration, not a bug.
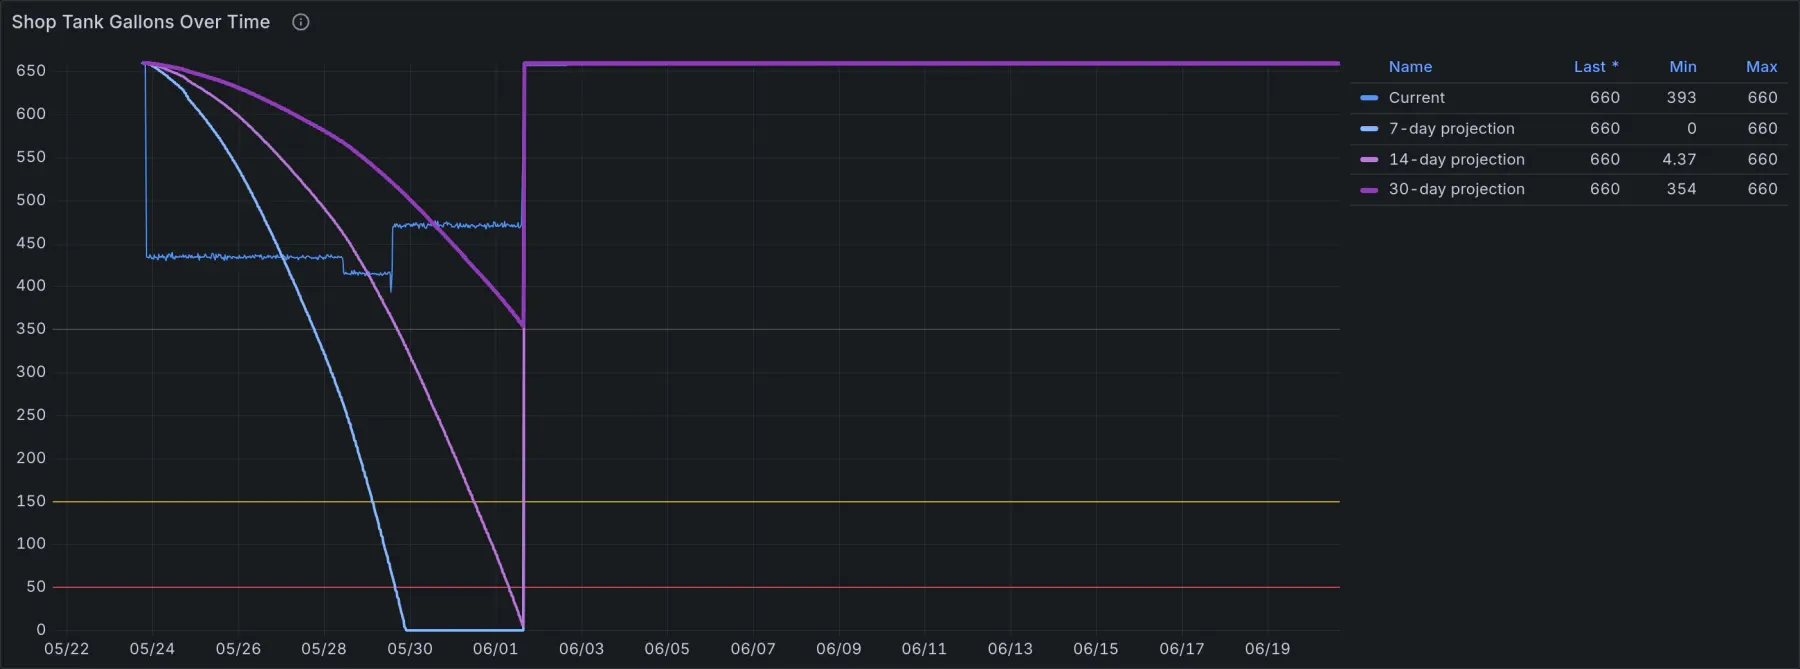
So: two tanks, two sensors, two formulas, one pipeline. The Dragino hands me a raw current I calibrate myself; the Rejeee hands me a finished depth I scale by geometry.
Stage 7: the Homestead dashboard
With both tanks flowing into Prometheus, the dashboard is where it becomes something I use. It is a single Grafana dashboard, Homestead, and the top row is the whole point: gallons remaining, percent full, days remaining, daily usage. Below that, history and health.
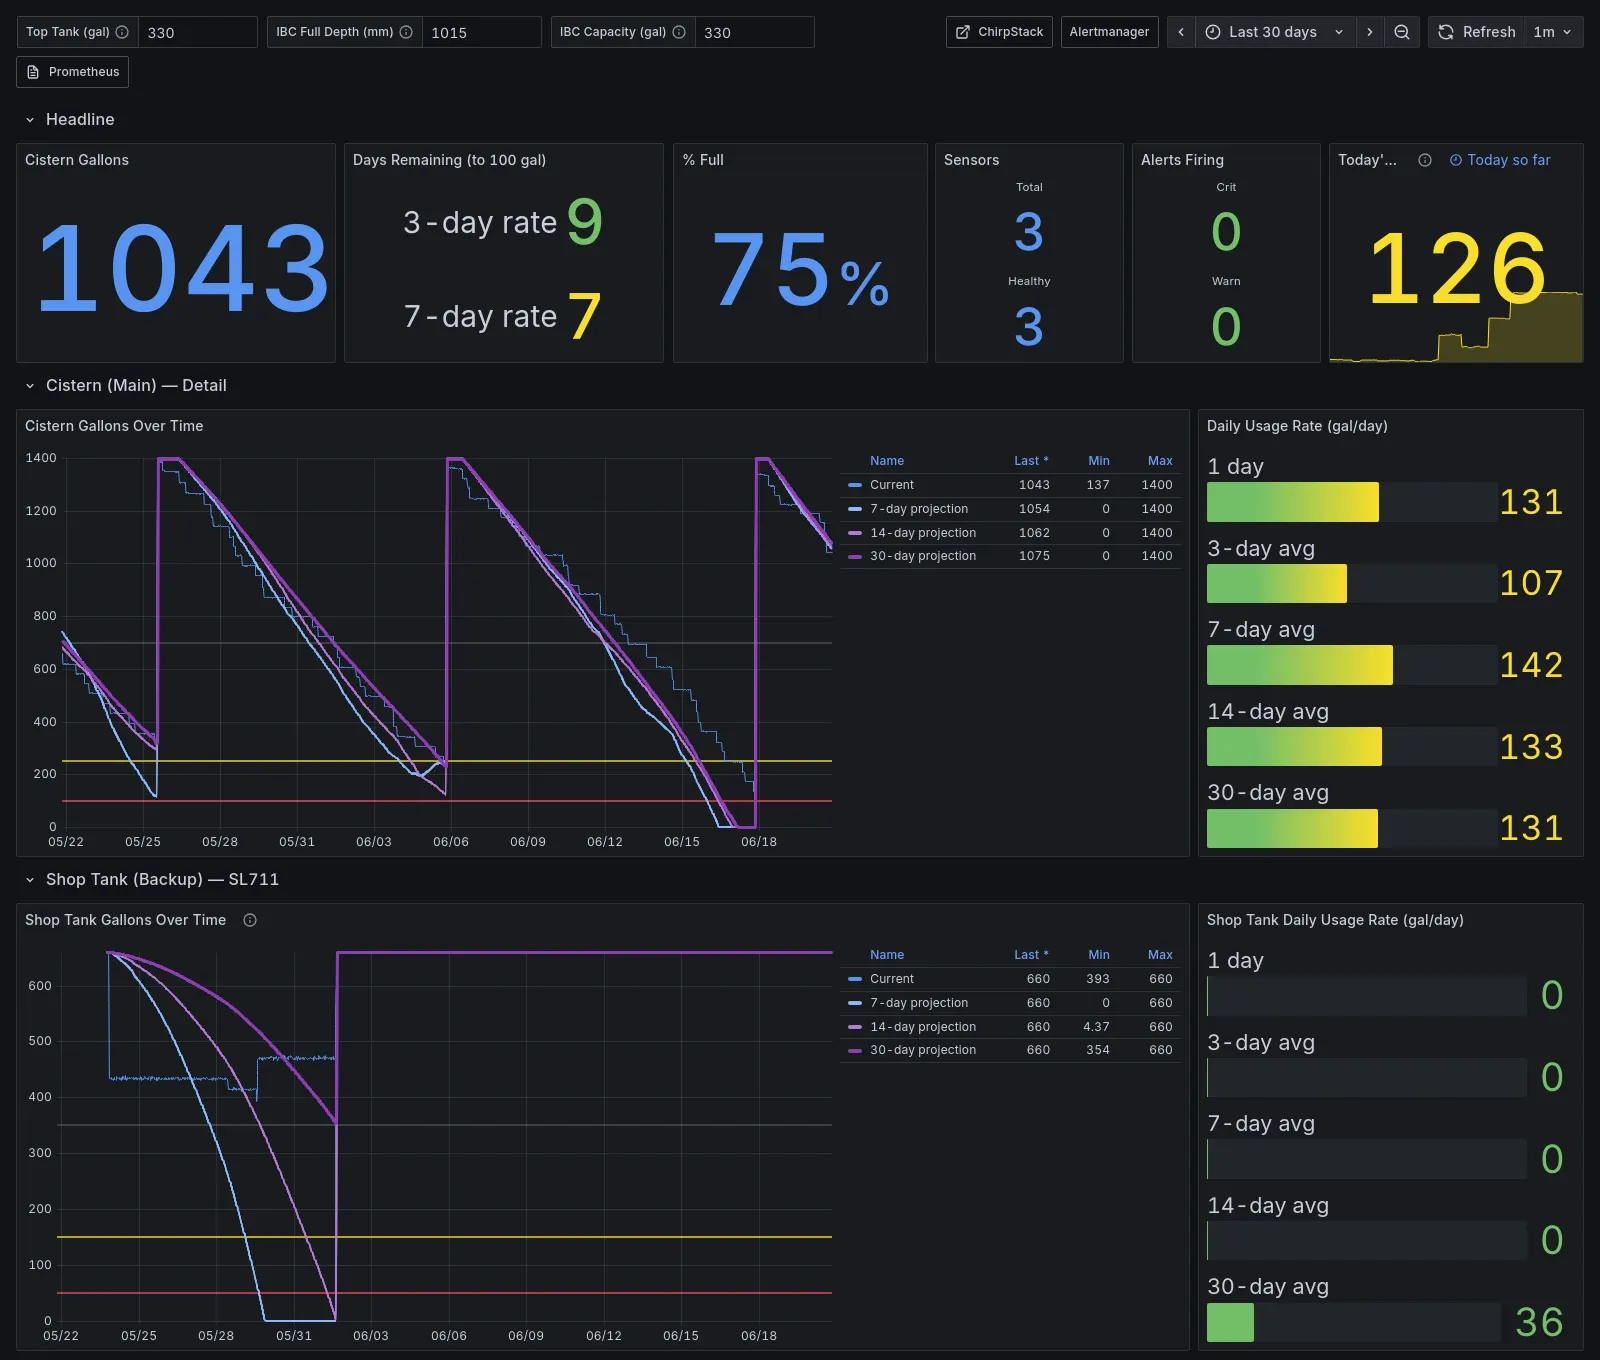
Percent full is just the gallons over capacity:
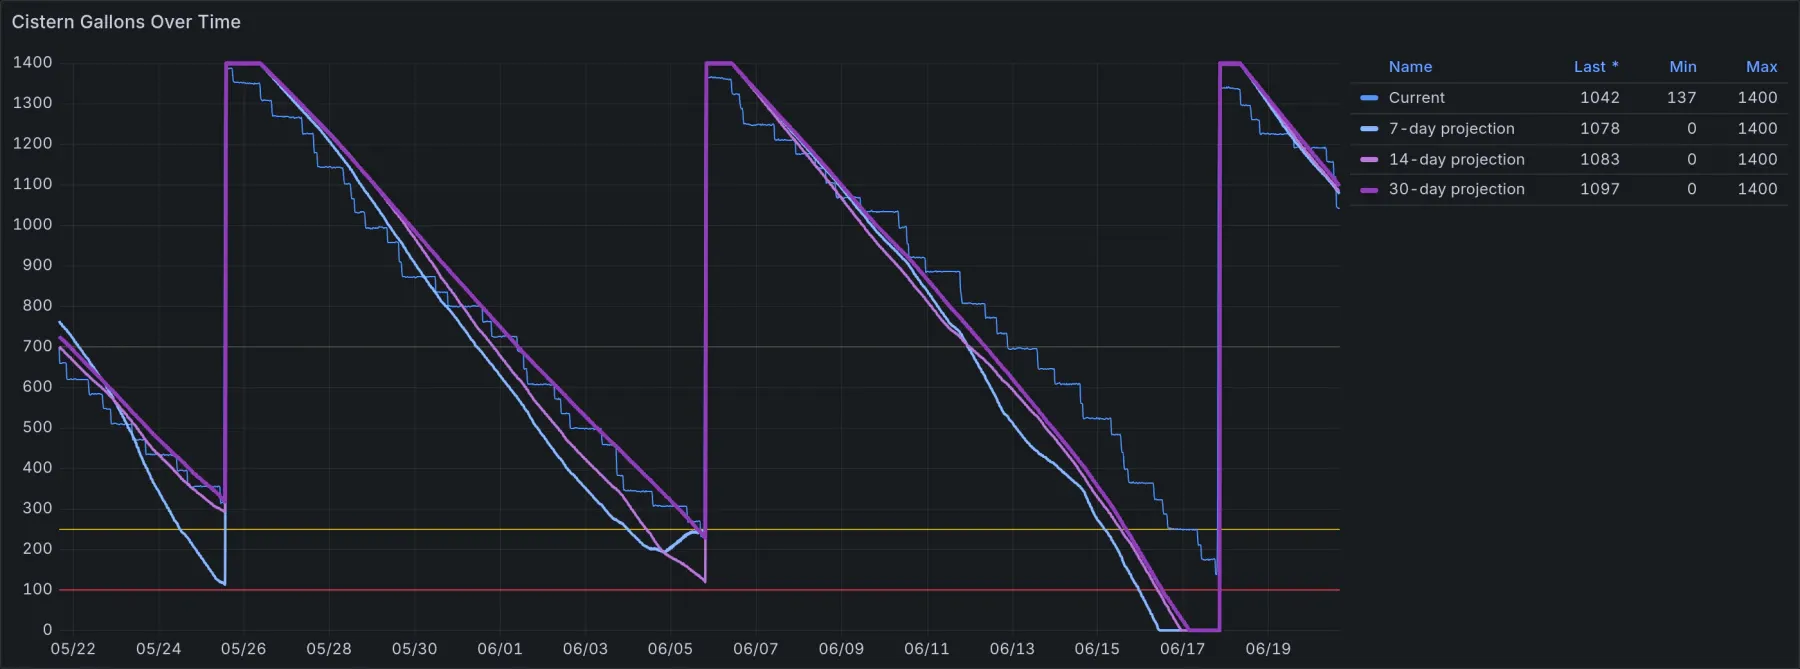
clamp((<gallons> / 1400) * 100, 0, 100)Cistern gallons over time is the panel I look at most. You can read the rhythm of the place off it: the steady sawtooth of daily draw, then the sharp vertical jump when I haul water in. The dashboard also draws a refill projection, extrapolating the drawdown forward from the last detected fill (gallons crossing back above ~1330, within reach of the 1400 full mark), so the trend anchors to the most recent top-up.
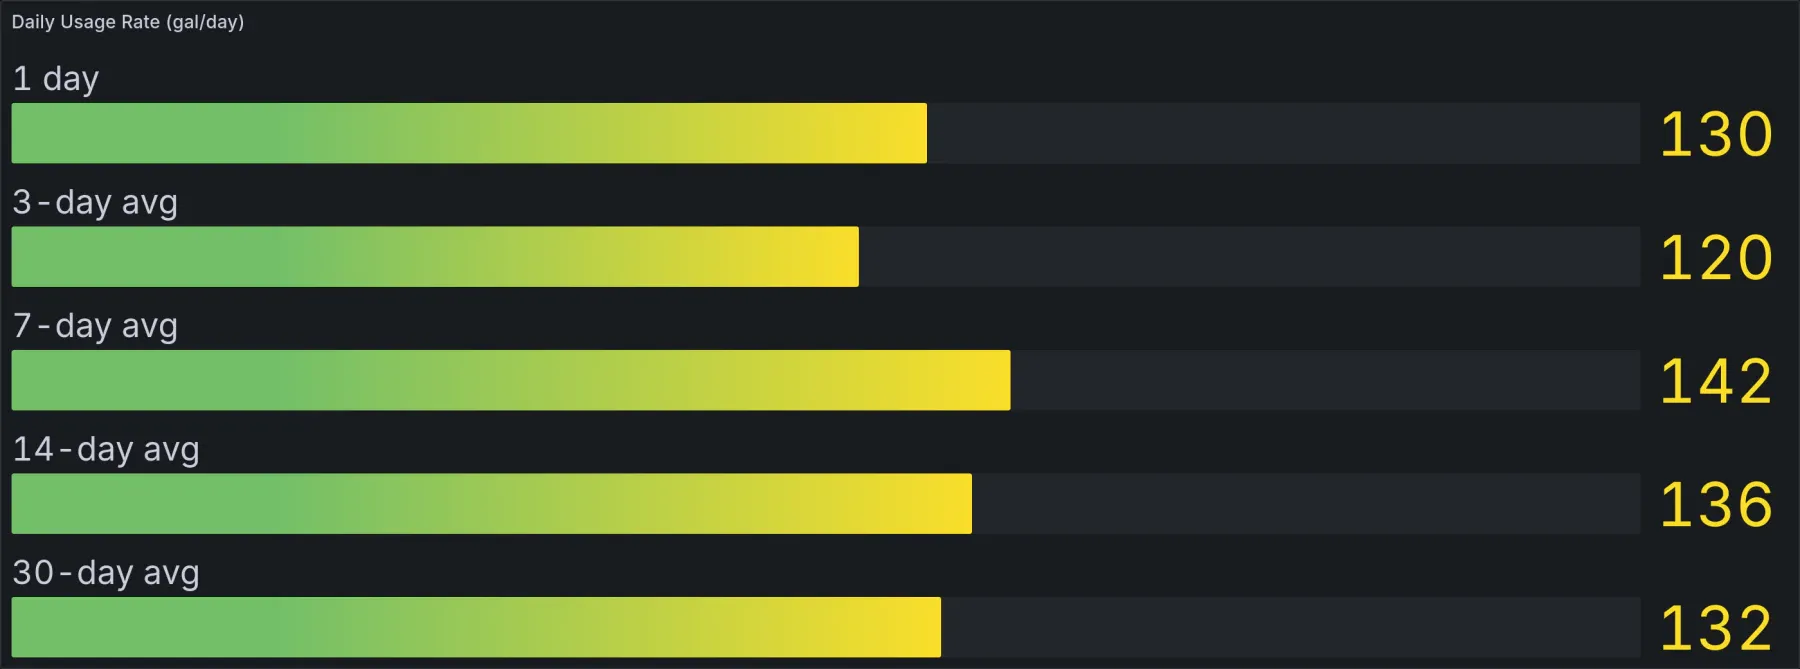
Daily usage counts only the level going down, so hauling water in never masks the real draw:
sum_over_time( (clamp_min( -delta(<gallons>[15m:]), 0 ))[<window>:15m] ) # / Ndays for an averageInside-out: delta is the change each 15 minutes, negative when draining; the leading minus flips draining to positive; clamp_min(..., 0) throws away the negatives, so a refill counts as zero usage; and sum_over_time adds up all the drops across the window. The result measures only water that left the tank.
Days remaining divides usable gallons by that daily rate:
clamp( (<gallons> - 100) / clamp_min(<avg_daily_usage>, 1), 0, 99 )The - 100 keeps a hundred-gallon reserve as the "act now" floor. The clamp_min(<avg_daily_usage>, 1) is the load-bearing guard: if recent usage is zero, dividing would blow up to infinity, so flooring the denominator at one gallon a day makes a quiet tank show a large finite number. The outer clamp(..., 0, 99) keeps the panel readable. That is the number that changes my behavior: when days-remaining drops into single digits, I schedule a haul.
Battery and signal round it out, per device, so I get warned before a sensor dies:
# battery
chirpstack_sensor_object_Bat_V        # cistern (Dragino, volts)
chirpstack_sensor_batteryLevel        # fleet percentage where reported

# radio
chirpstack_sensor_rxInfo_0_rssi       # signal strength, around -71 on the cistern
chirpstack_sensor_rxInfo_0_snr        # signal-to-noise, around 13.8
And a fleet-health tile counts how many sensors have checked in recently, leaning on the metric timestamp rather than waiting for a series to disappear:
count( group by (deviceInfo_devEui) ( (time() - timestamp(chirpstack_sensor_rxInfo_0_rssi)) < 7200 ) )That 7200-second (two-hour) window is why expiration_interval = "25h" in Telegraf matters: a quiet device does not vanish from the series, so the window decides "online," not the series existing.
The same pipeline quietly carries more than water. There are door and contact sensors on it too (DOOR_OPEN_STATUS, DOOR_OPEN_TIMES), and every device reports its own battery and radio signal onto the same health panels. Water was the reason I built it. Everything else is one more device on a pipeline that already exists.
Stage 8: glanceable extras and alerts
The dashboard is thorough, which makes it heavy for a five-second glance. So there is a tiny Flask page, the cistern dash, serving exactly one number: gallons remaining, large, on a single page at port 5055. It runs the identical cistern PromQL as the Grafana panel, against the same Prometheus, so the two can never disagree, and its source carries a comment to update both together if the calibration changes. That is the page I open from my phone while standing at the tank.
The other half of "act for me" is alerts. The whole reason to keep history is so a rule can watch it for me. A few I wrote: warn when days-remaining falls into single digits, warn when a sensor goes quiet past the two-hour window (a dead probe and an empty tank both read zero, so staleness is the honest signal), and warn when battery voltage sags toward the node's cutoff. The thresholds are mine to change in a line as I learn the rhythm of the place through the seasons, which is the whole reason I wanted the history.
What it cost, and what it is worth
The money is almost all in the gateway, and you buy it once. The RAK gateway was about four hundred dollars, and it serves every sensor on the property at the same time. After that the sensors are cheap, and they get cheaper as you move off the pricier analog ones: this water-level sensor ran around a hundred and fifty dollars, but a LoRaWAN door sensor is twenty, a water-leak sensor forty, a soil temperature and pH probe thirty. Each runs for years on its own battery with no wire back to anything. There is no subscription either, because ChirpStack, Telegraf, Prometheus, and Grafana all run on a NAS I already own. The real cost was a handful of quiet evenings of wiring, calibrating, and writing PromQL.
The payoff is the thing I wanted, and a few I did not know to ask for. I can see how full the cistern is from my phone without going outside. I can see how fast we are drawing it down and how many days that leaves. I get warned while there is still time to act, instead of finding out when the pump runs dry and the damage is already done. And the shop totes, the doors, and the battery and signal on every sensor came along for free, because once the pipeline exists, adding to it is mostly clicking through a few screens.
I did not build anything clever. I put a probe in the water, taught a cheap radio to read it, and pointed the same open-source stack I use for everything else at the result. I haul water to keep the tank full for now, and a ten-thousand-gallon cistern is going in soon; when it does, the same probe and the same dashboard move straight over, and only the calibration constants change. The question that used to mean a trip outside and a lid off a buried tank is now a number on my phone, smoothed and stored and trending. That turned out to be worth a few quiet evenings.
Comments
// Comments are reviewed before appearing. No spam. No noise.