
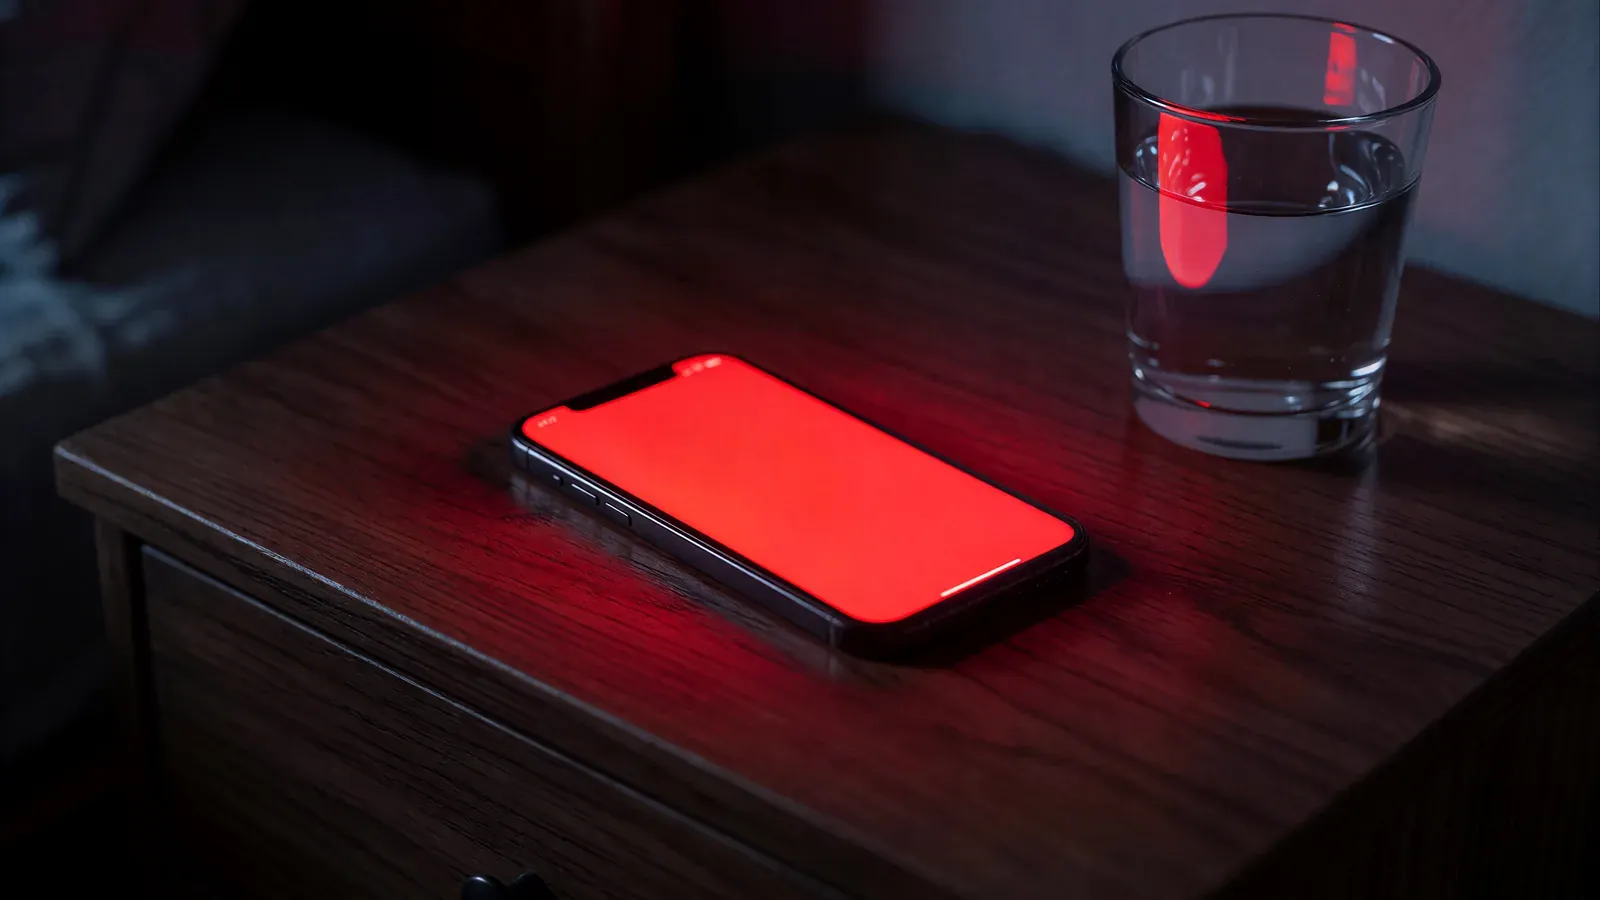
Water anywhere along the sensor's rope triggers a page to a phone in about 25 seconds, and the same event comes out of a speaker in the house as a spoken sentence. No dashboard has to be open and nobody has to be watching for it to work.
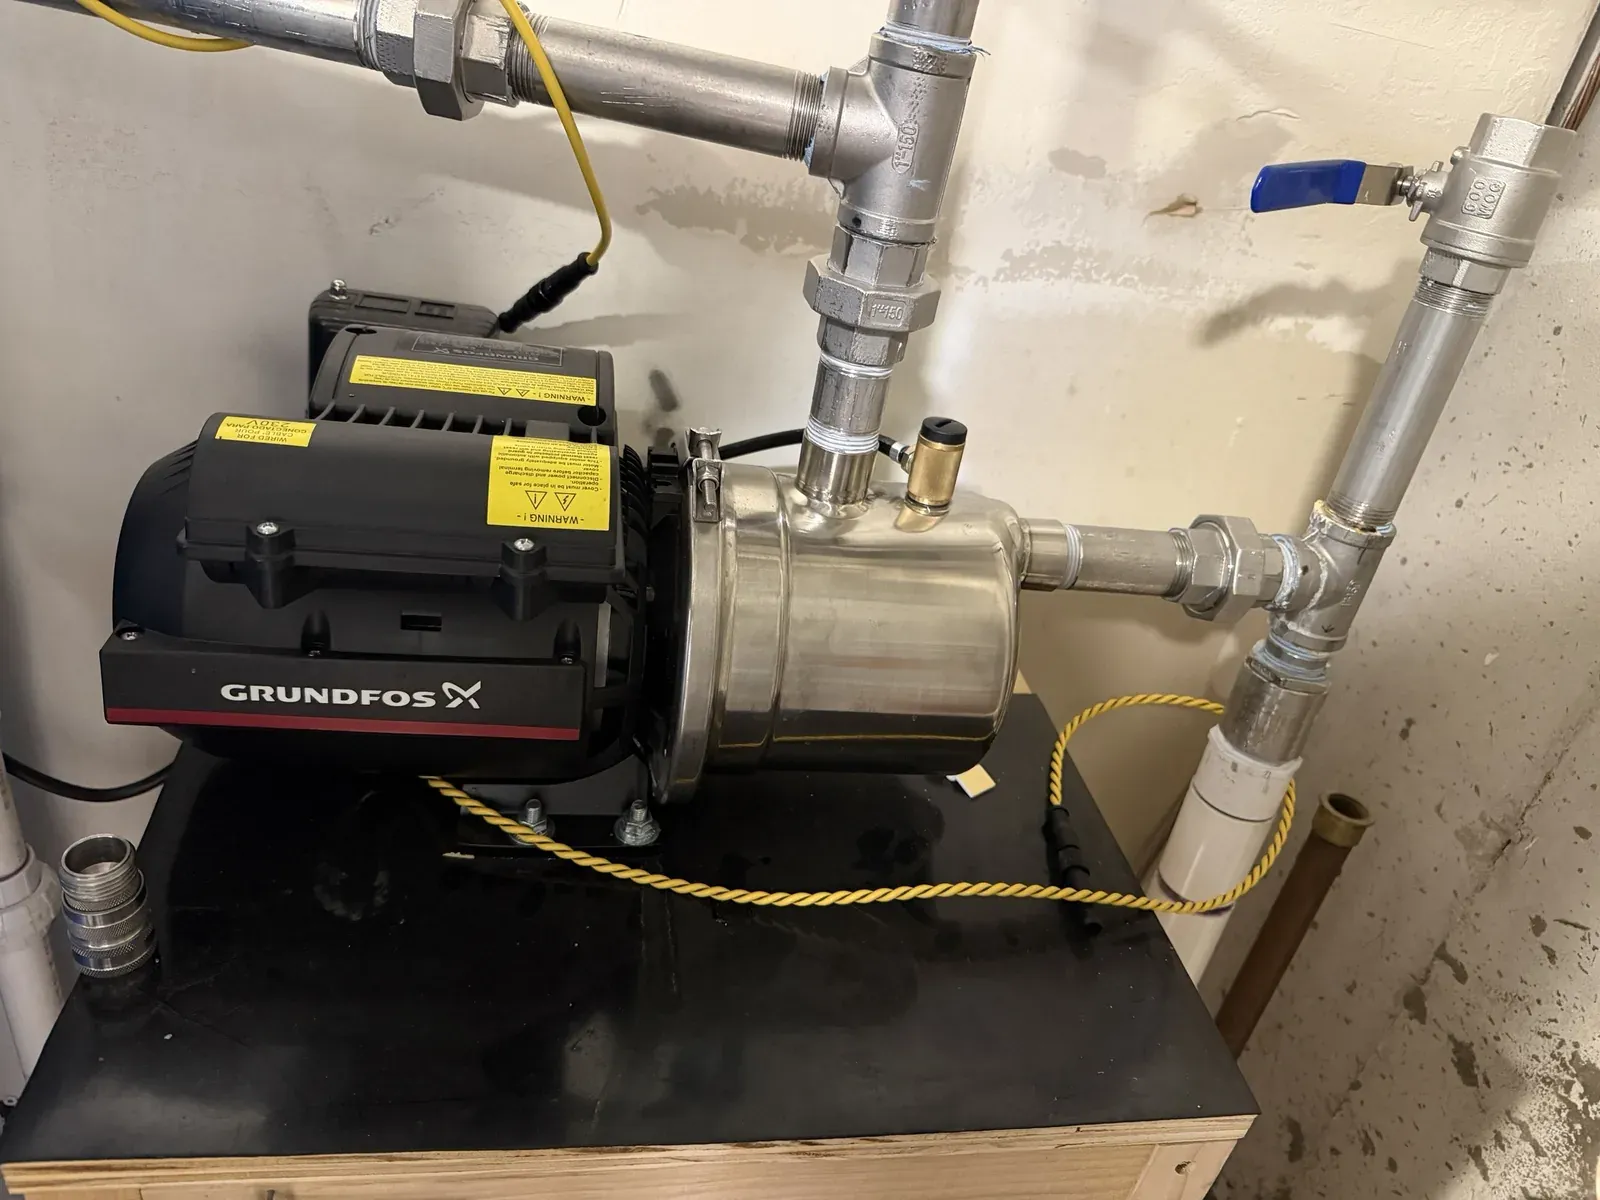
The sensor sits next to the booster pump that feeds the house from the cistern this same stack already reports on. A leak at that pump, a burst fitting, a cracked filter housing, a seal starting to go, is easy to miss for hours if nobody happens to be nearby. A rope sensor watches the whole run of pipe at once, so it does not matter exactly where along it the water shows up.
What you need
- A rope-type LoRaWAN leak sensor (this build uses a Dragino WL03A-LB)
- A LoRaWAN gateway in range
- ChirpStack, for the network server and the device's payload codec
- MQTT, telegraf, Prometheus, and Alertmanager, to carry a reading from ChirpStack to a page
- A pager app such as PagerDuty and/or Slack
- Optional: Grafana for a dashboard row, Home Assistant for a spoken announcement
This builds on a self-hosted stack that is already running. If ChirpStack, MQTT, telegraf, Prometheus, and Alertmanager are not already in place, set those up first; this walkthrough covers adding one more sensor to a pipeline that already exists.
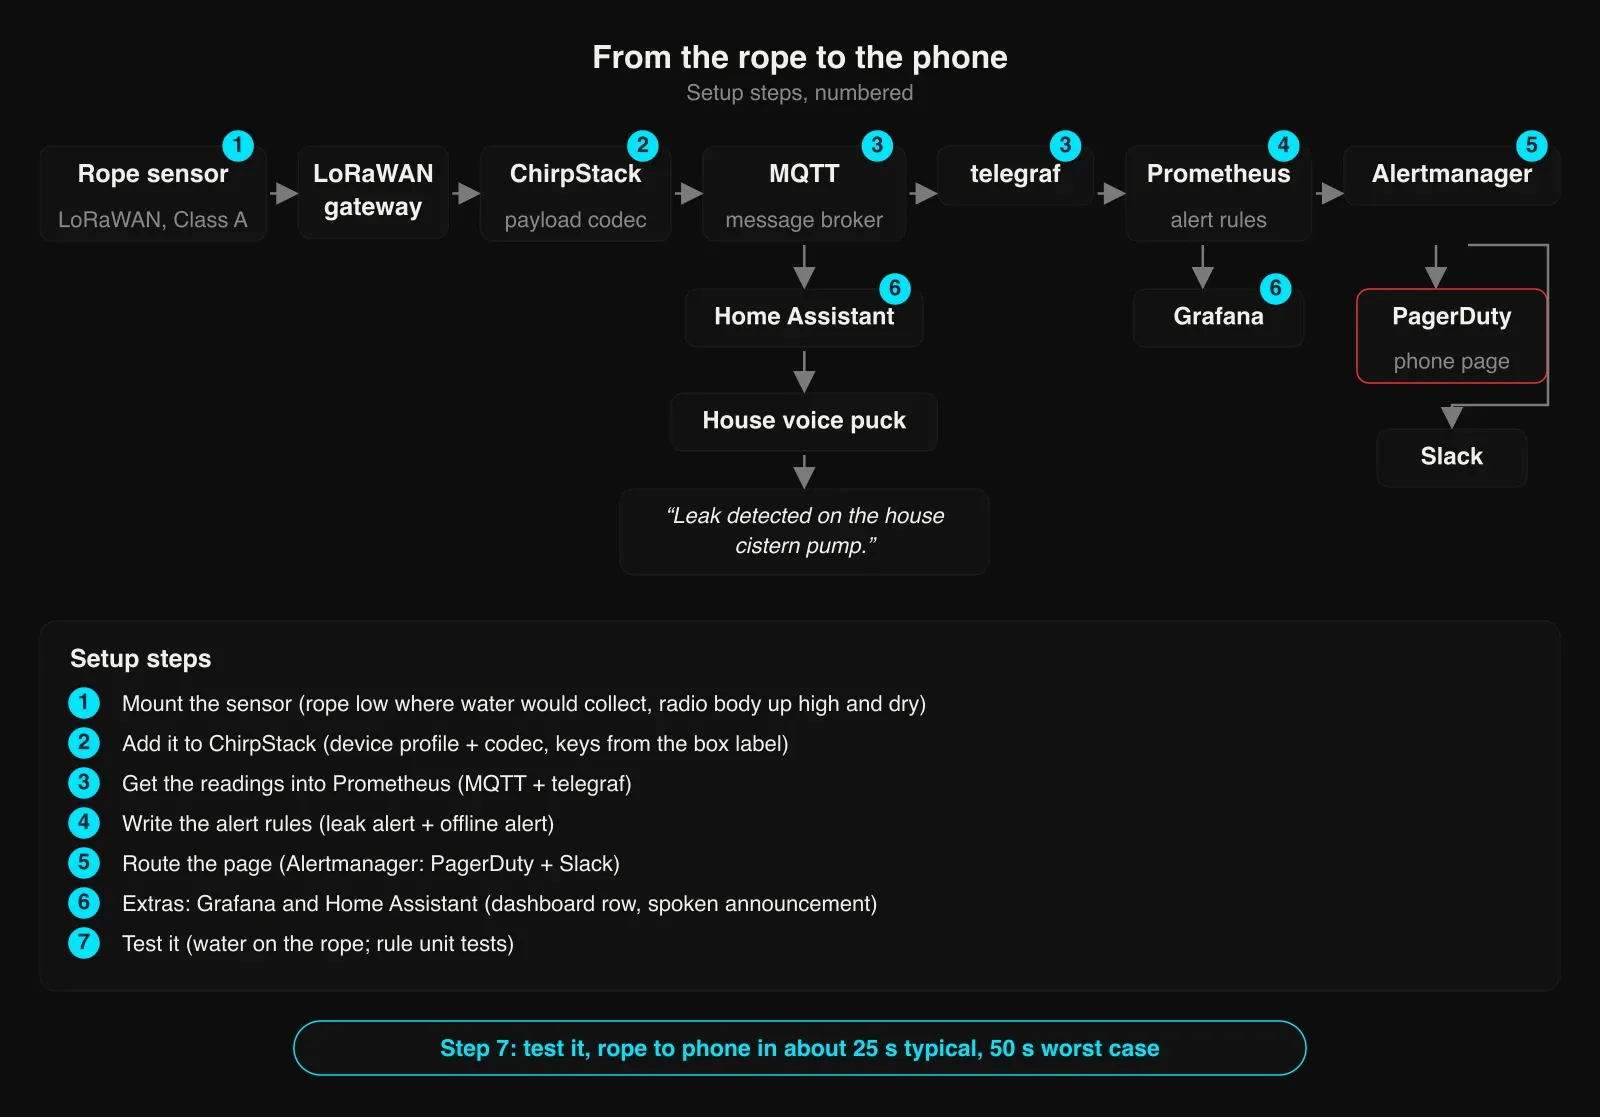
Step 1: Mount the sensor
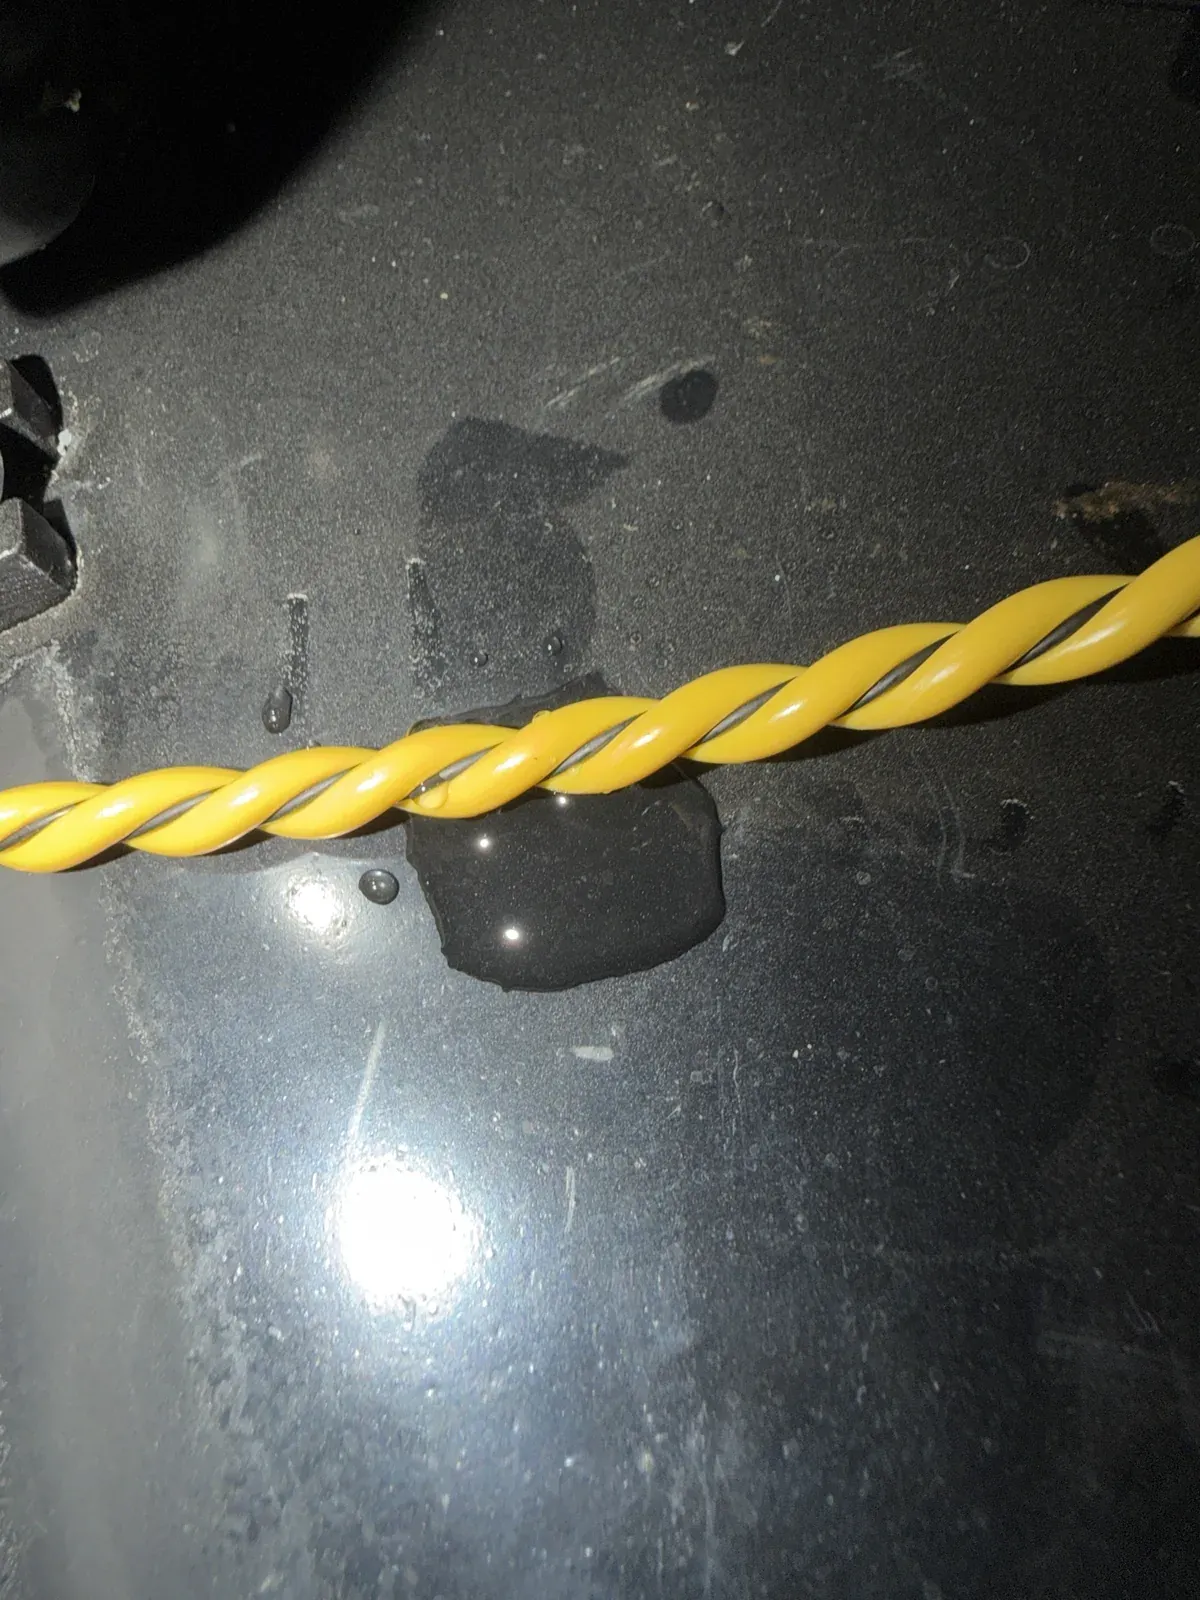
Rope goes low, radio body stays high and dry. This device does not care exactly where along its length water shows up, so route the rope to wherever a leak would puddle first: the low point on a stand, the base of a fitting, the floor under a valve.
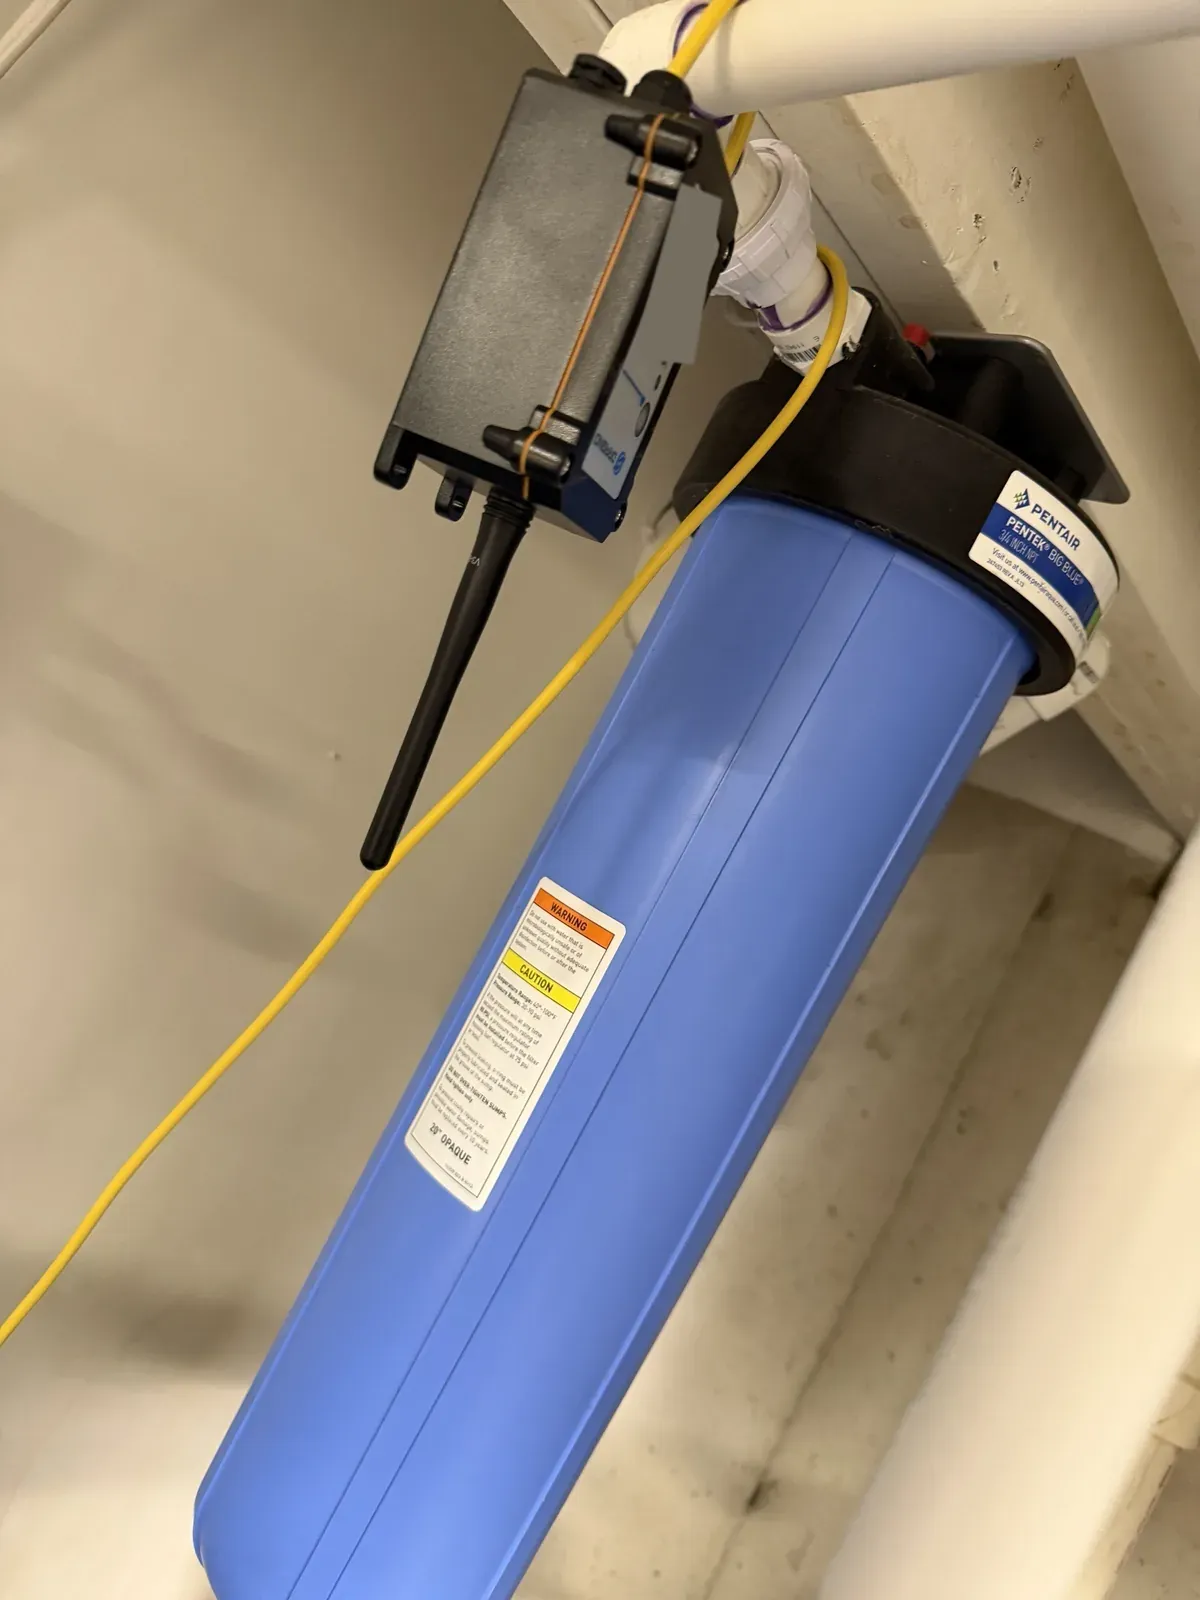
The sensor body itself is not rated for water contact, so it stays above the wet zone, wired only to the rope below it.
TIP: check the radio signal at the exact mounting spot before making the mount permanent. This one reads about -88 to -93 dBm RSSI with 10 to 12 dB of signal to noise at the pump. A join on the bench right next to the gateway reads much stronger (around -26 dBm here), so judge the signal where the sensor will actually live.
Step 2: Add it to ChirpStack
Register the device in ChirpStack with the DevEUI, JoinEUI, and AppKey printed on the box label. Reading those straight from the label's QR code with a small script and piping them into the ChirpStack API means the keys are never typed or displayed anywhere.
TIP: for a LoRaWAN 1.0.x device, the label's AppKey goes in ChirpStack's nwkKey field, not appKey. The appKey field is only for LoRaWAN 1.1 devices. Putting the key in the wrong field gives a join failure with nothing on the device page to explain why.
The vendor's stock ChirpStack codec for this sensor reports the leak state as text, the strings "LEAK" and "NO LEAK", with the alarm flag as "TRUE" or "FALSE". That matters once the reading has to reach Prometheus (Step 3), so patch the codec to emit numbers instead:
ALARM:(bytes[0]&0x02)>>1,
WATER_LEAK_STATUS:bytes[0]&0x01,
TIP: ChirpStack v4 runs codecs as an ES module, which executes in strict mode. The stock codec's datalog branch (fPort 3, used for historical uplinks) assigns to a variable, data_sum, without declaring it first, which throws in strict mode. Declare it before the loop that uses it:
var data_sum = "";Save the patched codec as the device profile's payload codec. Uplinks on every port, including the history port, then decode cleanly.
Step 3: Get the readings into Prometheus
ChirpStack publishes each uplink to MQTT. telegraf's mqtt_consumer input reads that topic, and its prometheus_client output turns the reading into a metric Prometheus can scrape:
[[inputs.mqtt_consumer]]
  servers = ["tcp://mosquitto:1883"]
  topics = ["application/+/device/+/event/up",
    "application/+/device/+/event/status"
  ]
  data_format = "json"
  tag_keys = ["deviceInfo_devEui", "deviceInfo_deviceName", "deviceInfo_applicationName"]
  name_override = "chirpstack_sensor"

[[outputs.prometheus_client]]
  listen = ":9273"
  path = "/metrics"
  expiration_interval = "96h"
TIP: telegraf's Prometheus output only exports numeric fields. A text value like the stock codec's "LEAK"/"NO LEAK" strings never becomes a metric at all, which is why the 0/1 patch in Step 2 has to happen before this step, not after.
TIP: battery percentage on this device class comes from a LoRaWAN status request ChirpStack sends roughly once a day, not from the sensor's own uplinks, so the gap between battery readings can run longer than a typical metric expiry. Set expiration_interval past that gap, 96 hours here, so a normal daily-report miss does not make the battery reading disappear.
Step 4: Write the alert rules
The leak alert is the one that has to be right, since it is the one that pages a phone:
- alert: WaterLeakDetected
  expr: |
    max by (deviceInfo_devEui, deviceInfo_deviceName) (chirpstack_sensor_object_WATER_LEAK_STATUS == 1)
    or on (deviceInfo_devEui)
    max by (deviceInfo_devEui, deviceInfo_deviceName) (increase(chirpstack_sensor_object_WATER_LEAK_TIMES[30m]) > 0)
  labels:
    severity: critical
    category: water
    page: "true"
It checks two things, not one: whether the sensor reads wet right now, and whether its leak-event counter has moved in the last 30 minutes. The second half is there because Prometheus only scrapes every 15 seconds; a brief wetting, a splash, a quick touch during a test, can start and end between two scrapes and never show up as a wet reading, even though the sensor logged it as an event.
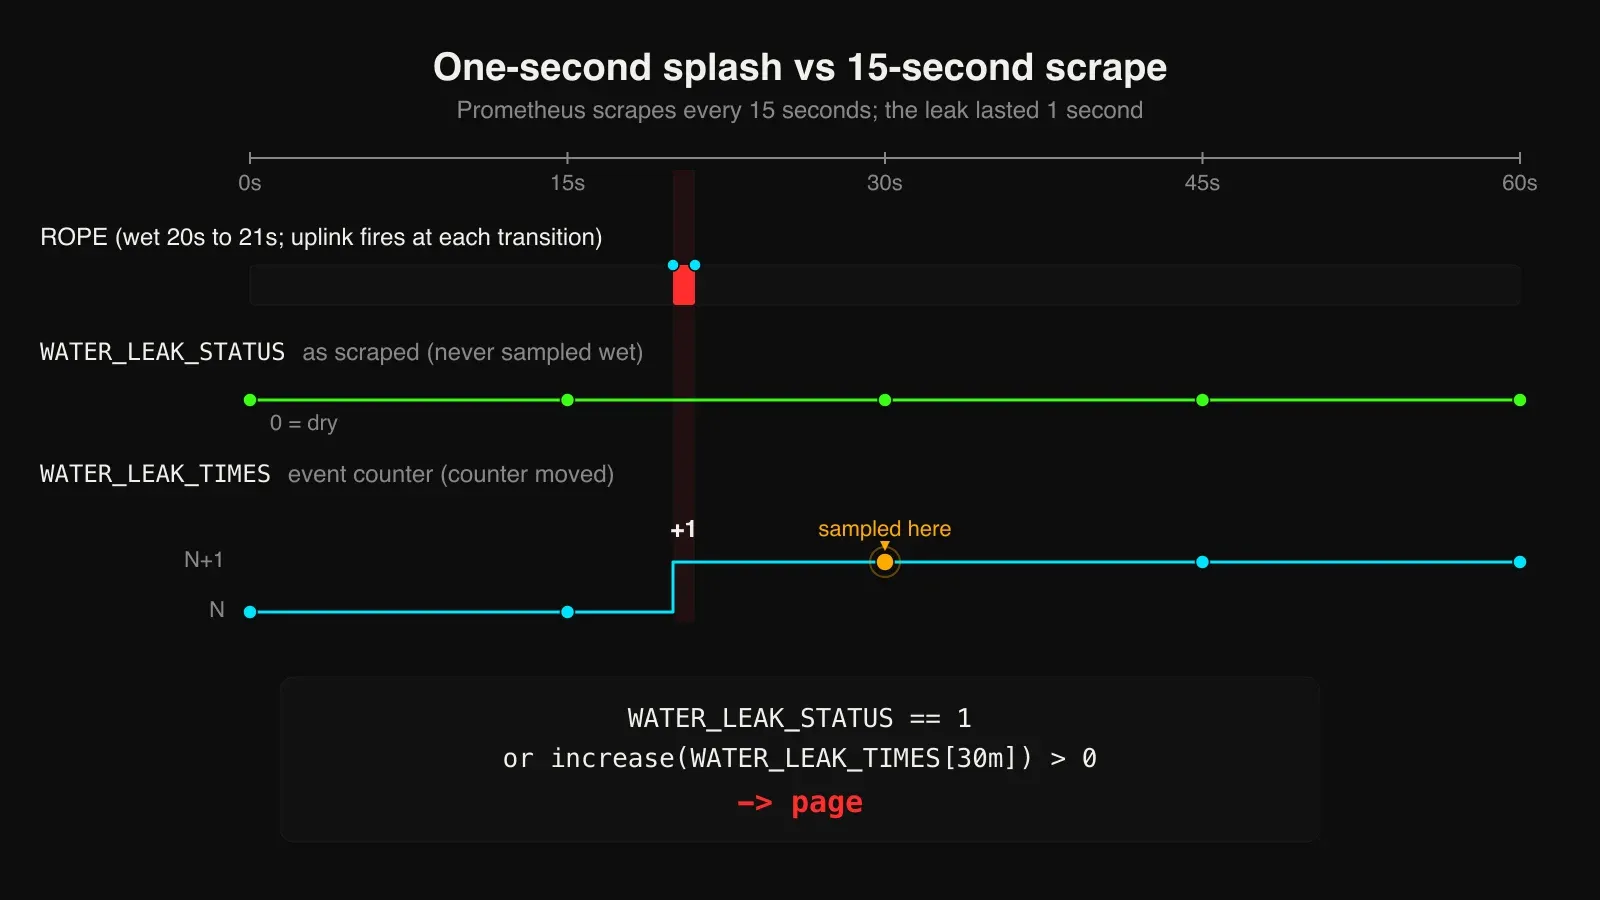
Both halves of the expression carry the same labels, so this is one alert and one incident per sensor, never two. It clears itself 30 minutes after the last recorded water event, and the rule group for this alert runs every 15 seconds instead of the usual one-minute default, so there is less waiting for the next evaluation.
The second rule watches for a sensor that has gone quiet:
max by (deviceInfo_devEui, deviceInfo_deviceName) (last_over_time(chirpstack_sensor_object_WATER_LEAK_STATUS[14d]))
unless on (deviceInfo_devEui)
(
  (max by (deviceInfo_devEui) (changes(chirpstack_sensor_fCnt[5h])) > 0)
  or
  max by (deviceInfo_devEui) (chirpstack_sensor_fCnt unless on (deviceInfo_devEui) (chirpstack_sensor_fCnt offset 5h))
)
TIP: detect silence with the LoRaWAN frame counter (fCnt), not with a timestamp comparison. telegraf re-exports the last scraped value on every scrape, so time() - timestamp(metric) always measures time since the last scrape rather than time since the last uplink, and reads as fresh no matter how old the reading actually is.
TIP: the last clause, a frame counter series that exists now but did not exist five hours ago, keeps a sensor that just joined from reading as offline before it has had a chance to send a second uplink to compare against.
Step 5: Route the page
Alertmanager routes on the page label, so only alerts that opt in reach PagerDuty:
route:
  receiver: "slack-notifications"
  group_by: ['alertname', 'deviceInfo_devEui']
  group_wait: 10s
  group_interval: 5m
  repeat_interval: 24h
  routes:
    - matchers:
        - page="true"
      receiver: "slack-notifications"
      continue: true
    - matchers:
        - page="true"
      receiver: "pagerduty"
      repeat_interval: 4h
      continue: false
An alert labeled page: "true", like the leak alert from Step 4, goes to Slack and PagerDuty both. Everything else falls through to the root receiver and reaches Slack only. The shorter four-hour repeat on the PagerDuty branch means a leak that is still active keeps re-notifying instead of going quiet for a full day.
Step 6: Extras: Grafana and Home Assistant
A Grafana row for leak sensors can query by field name rather than by device name, so a new sensor shows up on it the moment it joins: current state (dry or leak), a state timeline, time since the last uplink, a count of leak events, and battery.
Home Assistant can subscribe to the same MQTT topics as everything else in the pipeline. A binary sensor exposes the leak state, and an automation turns it into a spoken announcement:
mqtt:
  binary_sensor:
    - name: "House Cistern Pump Leak"
      unique_id: cistern_pump_leak
      state_topic: "application/+/device/<DEV_EUI>/event/up"
      device_class: moisture
      payload_on: "ON"
      payload_off: "OFF"
      value_template: "{% if value_json.object is defined and value_json.object.WATER_LEAK_STATUS is defined %}{{ 'ON' if (value_json.object.WATER_LEAK_STATUS | int(0)) == 1 else 'OFF' }}{% endif %}"

automation:
  - id: cistern_pump_leak_announce
    alias: "House cistern pump leak announce"
    trigger:
      - platform: state
        entity_id: binary_sensor.house_cistern_pump_leak
        to: "on"
    action:
      - action: tts.speak
        target:
          entity_id: tts.piper
        data:
          media_player_entity_id: media_player.house_speaker
          message: "Leak detected on the house cistern pump."
<DEV_EUI> is a placeholder; use the device's own ID from ChirpStack.
Step 7: Test it
Wet the rope and watch the phone. The full path is telegraf's flush (10 s) plus the Prometheus scrape (15 s) plus the rule evaluation (15 s) plus Alertmanager's group wait (10 s): about 25 seconds typical, since an uplink usually lands partway through each interval, and about 50 seconds worst case.
Beyond the water test, each alert rule is worth a promtool unit test: wet then dry, a wetting shorter than one scrape, a leak held open past 30 minutes, a fresh join, and a sensor gone quiet past its expiry. A few lines of YAML per case catches a bad rule edit before it ever reaches the real sensor.
Comments
// Comments are reviewed before appearing. No spam. No noise.