
I run my own weather service on the small Linux box that already hosts my home Docker fleet. It gives me everything I used AccuWeather for (near-real-time rain from a 15-minute HRRR-backed nowcast, animated radar, severe-weather alerts) with none of what I resented (ads, bloat, dark patterns, a homepage that loads a small country's worth of JavaScript). It costs $0 a month in data, idles at about 125 MB of RAM in a single container, and it stays up when the internet upstream of it does not. On launch day it proved that last point without me lifting a finger.
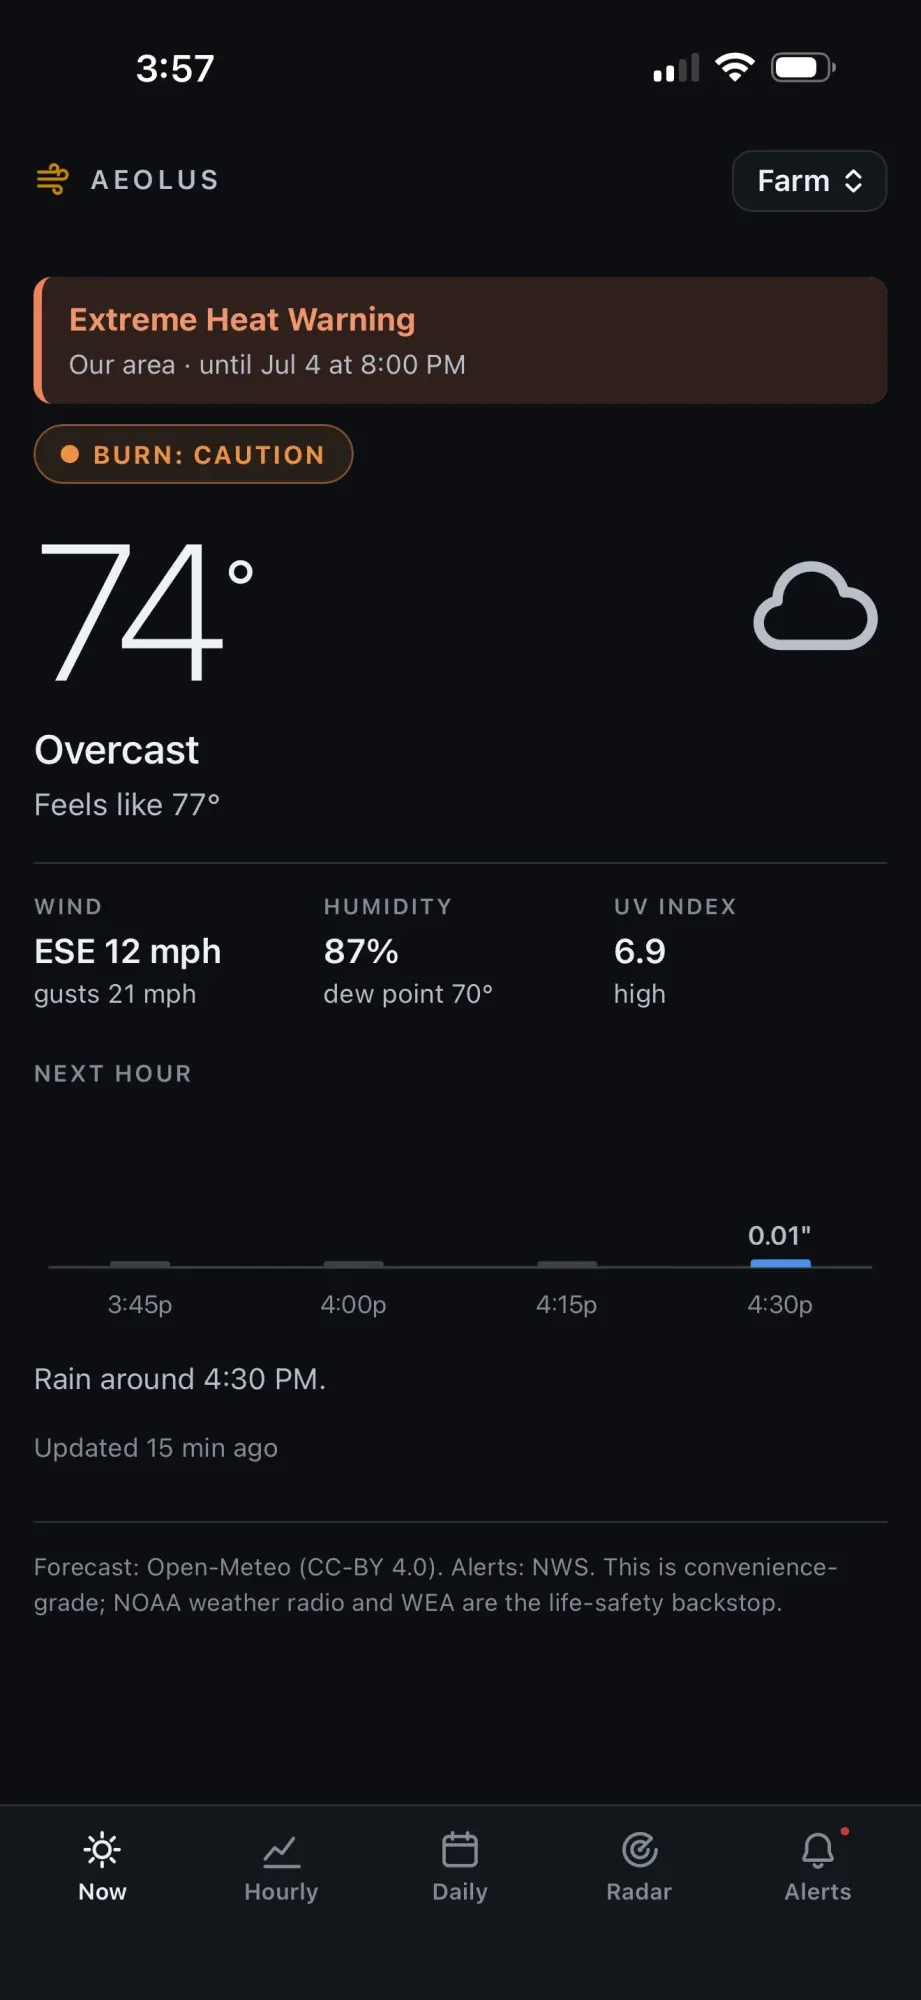
The service is a phone-first installable web app called Aeolus: a NOW view, a 48-hour meteogram, a 10-day burn-window outlook, animated NEXRAD radar over a self-hosted map, and severe-weather alerts pushed to the family Slack. The whole family reaches it from anywhere at a private subdomain, with no ports opened at home. It replaced an app I opened constantly and trusted less every time.
This is the guide I wish I had before I started. It is not line-by-line code. It is every main feature, every architectural decision with the reasoning behind it, and the specific gotchas that cost me real hours, so a competent self-hoster can build their own version without rediscovering any of it the hard way. The stack is deliberately boring: Flask and gunicorn over SQLite on the backend, a vanilla PWA with vendored MapLibre on the front end, shipped as a single Docker Compose service.
The one decision everything hangs on: the cache is the product
The core decision came before any code. Upstream weather APIs are commodities. They rate-limit, they change schemas, they go down (NWS documents multi-hour degradations and publishes no SLA at all). If any upstream sits in the request path of a user, then the user's experience is only as reliable as the worst-behaved API on its worst day. So I refused to let any upstream sit in that path.
Instead, background poller threads fetch each upstream on its own natural cadence and write into a local SQLite store. Each poller writes its latest normalized payload as a JSON blob into a single cache table keyed by (source, endpoint) with a fetched_at column, and the database is opened in WAL mode so the reader workers never block the single writer. Every consumer, including the UI, reads only from that store. The upstreams are expendable. The cache is the thing I own, and it is what I actually serve.
Three design rules fall out of this and are worth adopting wholesale:
Every payload the service hands out carries three fields: which source it came from (source), when it was fetched (fetched_at), and whether it is stale (a stale flag). A payload flips to stale when now minus fetched_at exceeds that source's max age (I use roughly twice its poll cadence), so a source that quietly stops updating badges itself. The UI shows "updated N min ago" and badges stale data rather than hiding it. Honest degradation beats a blank tile.
Polling is centralized and single-writer. With multiple gunicorn workers you do not want each one polling the same API. My poller threads elect a single leader through a flock-based file lock, so N web workers still means one set of polls, and if the leader worker dies the lock releases and another worker takes over polling. If you skip this you multiply your API usage by your worker count and eventually trip a rate limit you did not know you were near.
Configuration is entirely environment variables. Every threshold, key, cadence, and coordinate is an env var, which means the same image runs for anyone and nothing sensitive is baked into the code.
This inverts the usual homelab weather widget, a thin proxy that goes dark the moment its one API hiccups. A cache-first design degrades honestly instead, which is the entire reason it is trustworthy.

Picking your sources: keys, etiquette, and what is actually alive
Before committing to any source I checked which free feeds were actually alive and under what terms. That pass changed the plan, and it is worth doing yourself because the terms matter more than the feature lists.
Forecasts come from two independent providers so a single outage cannot dark the whole service. Open-Meteo is primary: no API key, free for non-commercial use at 10,000 calls a day (household polling uses about 3% of that), a long horizon, and a 15-minute nowcast backed by HRRR. Pirate Weather is secondary: it needs a free API key (the 10,000-calls-a-month tier is plenty for hourly polling) and speaks the old Dark Sky schema. Two sources that share one provider's infrastructure share its outages. A separate provider on its own key and schema is what kept the service serving on launch day.
Alerts come from NWS (api.weather.gov), which needs no key but has two requirements people miss. It requires an identifying User-Agent header with a contact email, and it documents a 30-second minimum poll interval. Respect both or you will eventually get blocked. NWS is the alert authority here, and that is the one job assigned to it.
Finding your own location codes: query api.weather.gov/points/{lat},{lon} once. The response hands you your forecast zone code and your county zone code. You need both, and which one you poll for alerts matters (more on that below). This is also how readers avoid hardcoding anyone else's zone codes.
Poll cadences are set by how often the underlying data actually changes, not by how fresh you wish it were. Forecasts update hourly at most, because the numerical models themselves run about hourly (HRRR runs roughly every hour with about 50 minutes of latency), so polling faster than hourly buys you nothing but load. The nowcast polls every 5 minutes. Alerts poll every 60 seconds, tightening to 30 seconds during an active convective watch. Matching each source's real update rate keeps the data fresh without needless polling.
Normalization: make the UI source-blind
Each source speaks its own schema. Open-Meteo has its field names, Pirate Weather speaks Dark Sky. If that difference reaches your UI, your failover will be visible and ugly.
The fix is a normalization layer that adapts every source into one canonical schema at serve time: temp_f, humidity_pct (0 to 100), precip_prob_pct, wind_mph, a condition enum, and so on. The UI only ever sees canonical fields, so it does not know or care which upstream produced them. Failover becomes invisible. This is not busywork. On launch day the primary died and the UI rendered secondary data identically, because the UI could not tell the difference. Build this layer early; retrofitting it after the UI reads raw provider fields is miserable.
The alert pipeline and its gotchas
Alerts are the subsystem where the ugly real-world detail lives, and where a naive implementation will either spam you or miss a warning. The decisions that mattered:
Poll by county zone, not forecast zone. The county zone catches both county-issued warnings and zone-issued watches; the forecast zone misses some. Poll the county.
Dedupe by VTEC event key, never by message id. Every update to an event gets a brand-new message id, so deduping by id re-notifies forever. The stable identity is the VTEC key: issuing office, phenomenon, significance, event number, and year together. Dedupe on that tuple.
Handle the empty-references continuation. A continuation message can arrive typed as a new alert with an empty references list. If you treat a missing references list as "this is new," you will re-notify on every continuation of a long-lived warning. This one cost me real time; budget for it.
Annotate, do not filter. For each alert, compute whether it affects your point: a polygon containment test when the alert carries geometry, falling back to zone containment when it does not. Then annotate the alert with that result rather than filtering on it. The UI can distinguish "our area" from "elsewhere in the county" without hiding near misses, which is exactly what you want for something moving toward you.
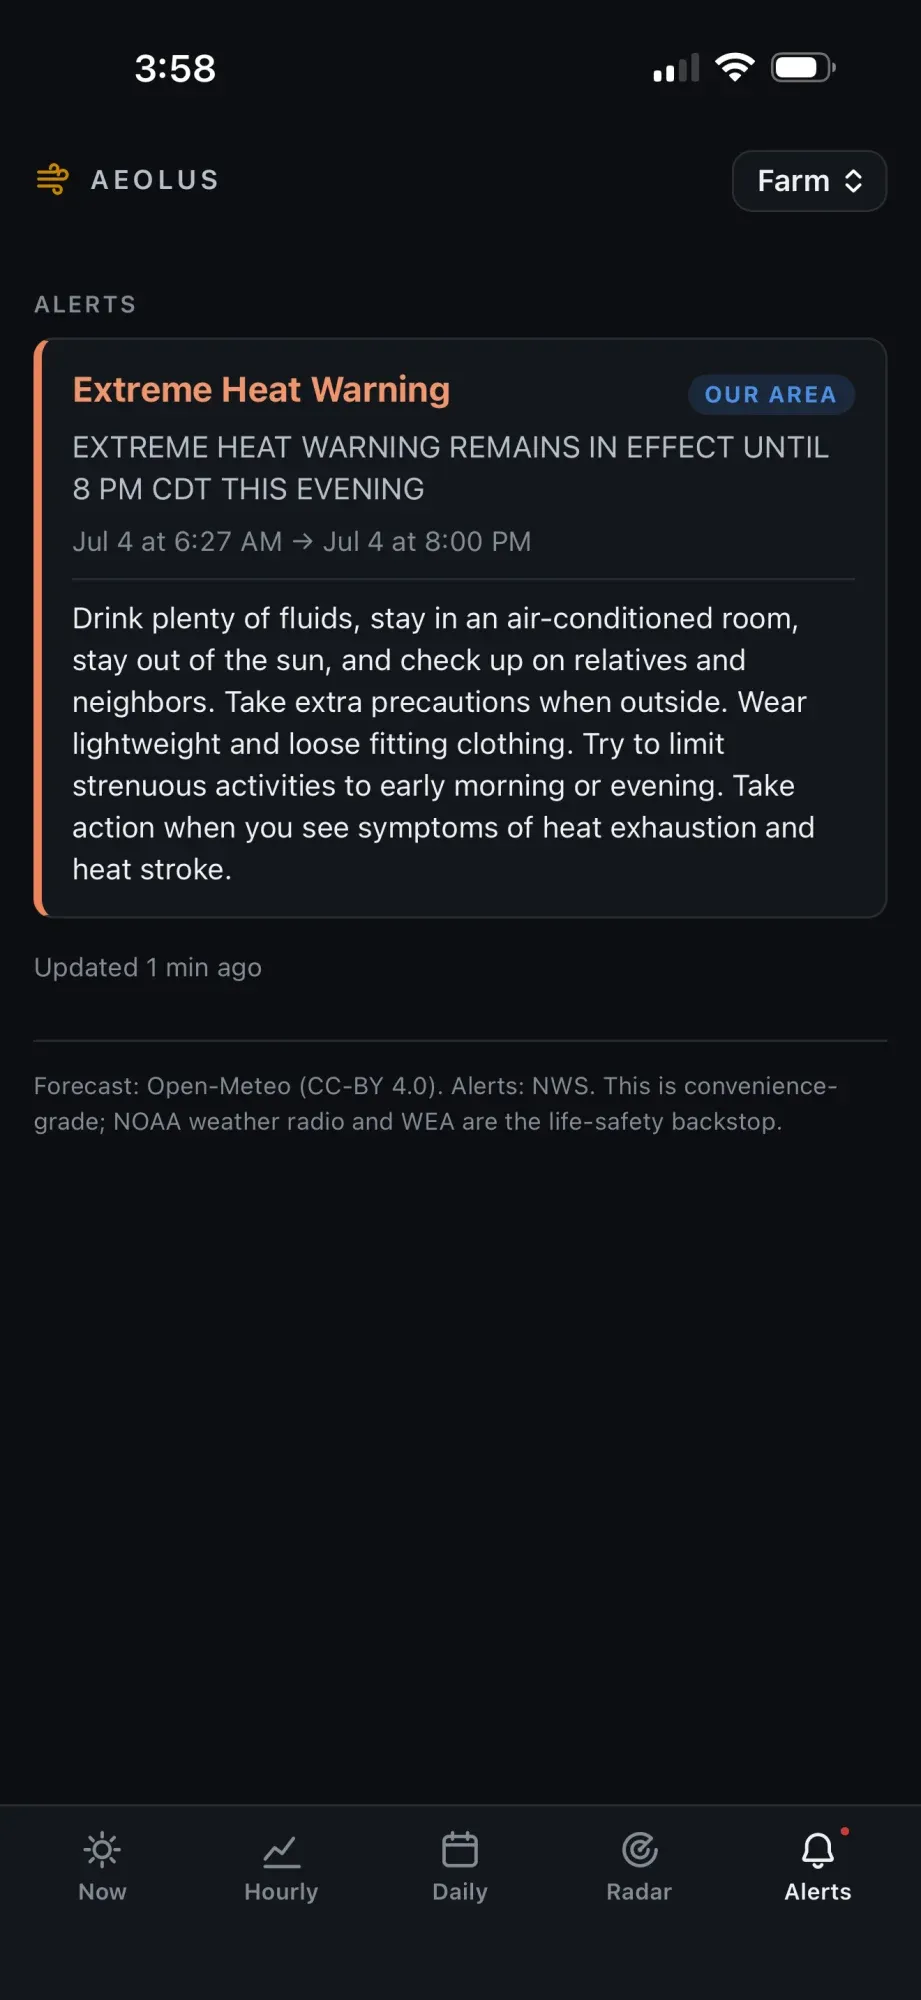
Build a true second path. The legacy NWS CAP feeds are dead, so "poll NWS twice" is not redundancy. A genuinely independent second path is Iowa Environmental Mesonet's storm-based-warning GeoJSON. A watchdog compares it against the primary NWS poll and alarms if the primary goes silent while the second path shows warnings. A warning now has to be missing from two independent pipelines before I miss it.
Two Slack tiers through one webhook. A single incoming webhook drives both tiers. Warnings post immediately and bypass quiet hours (tornado warnings get an @channel). Watches batch into a morning digest, because nobody needs a 2 a.m. buzz for a maybe; quiet hours run 22:00 to 07:00. Within a single event, re-notify only on escalation, and post an all-clear on cancellation or expiry. Nobody has learned to tune these out, which is what keeps an alert channel worth reading.
One non-negotiable: the UI carries a standing disclaimer that this is convenience-grade, and that NOAA weather radio and Wireless Emergency Alerts are the life-safety backstop. Self-hosted severe-weather alerting is a convenience layer on top of the real system, never a replacement for it. Say so, plainly, in the app.
Honest forecasting: show skill, badge the rest
The forecast UI is built around what the models actually know.
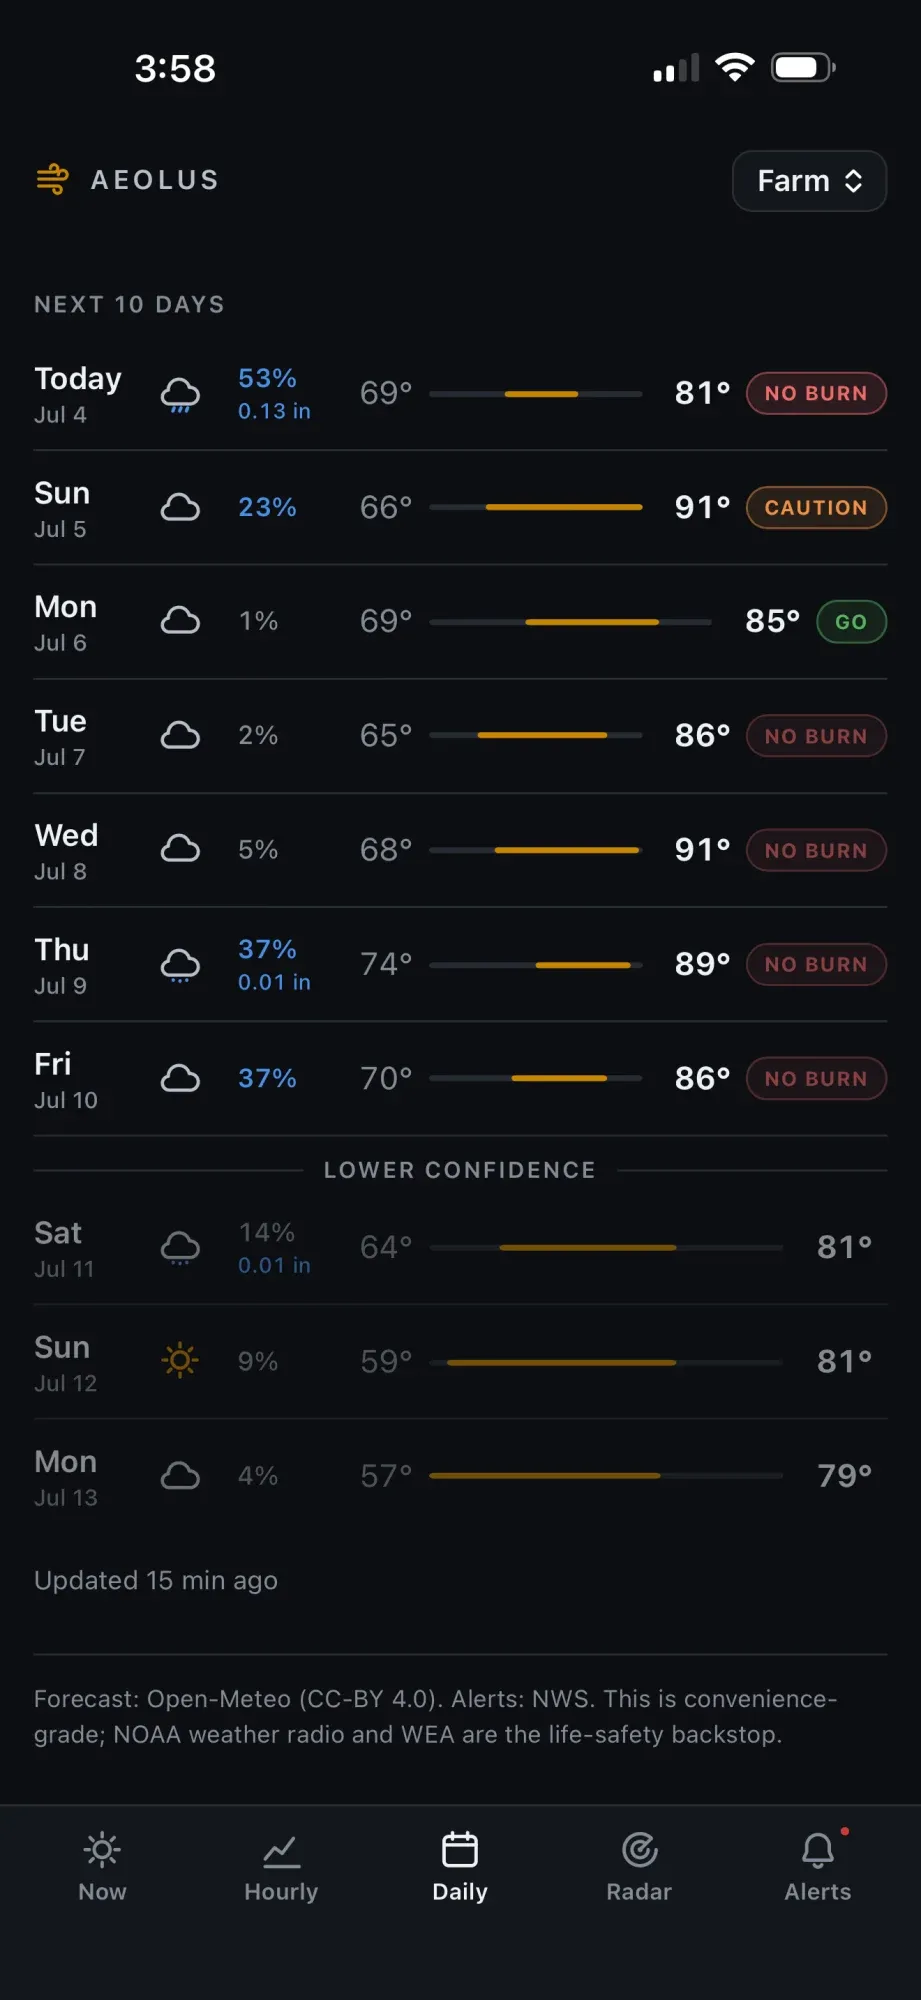
The hourly view runs to 48 hours. The daily view caps at 10 days, and days 8 through 10 are visually de-emphasized because daily forecast skill collapses around day 8. The 14-to-16-day forecasts other apps display are past the range of any real model skill. Capping at 10 and dimming the last three is a small honesty that costs nothing and separates this from the glossy apps that pretend to know more.
The same staleness contract applies here, so the UI dims forecasts once they go old.
The meteogram and the burn window
This runs on a ridgetop farm, and the UI reflects that.
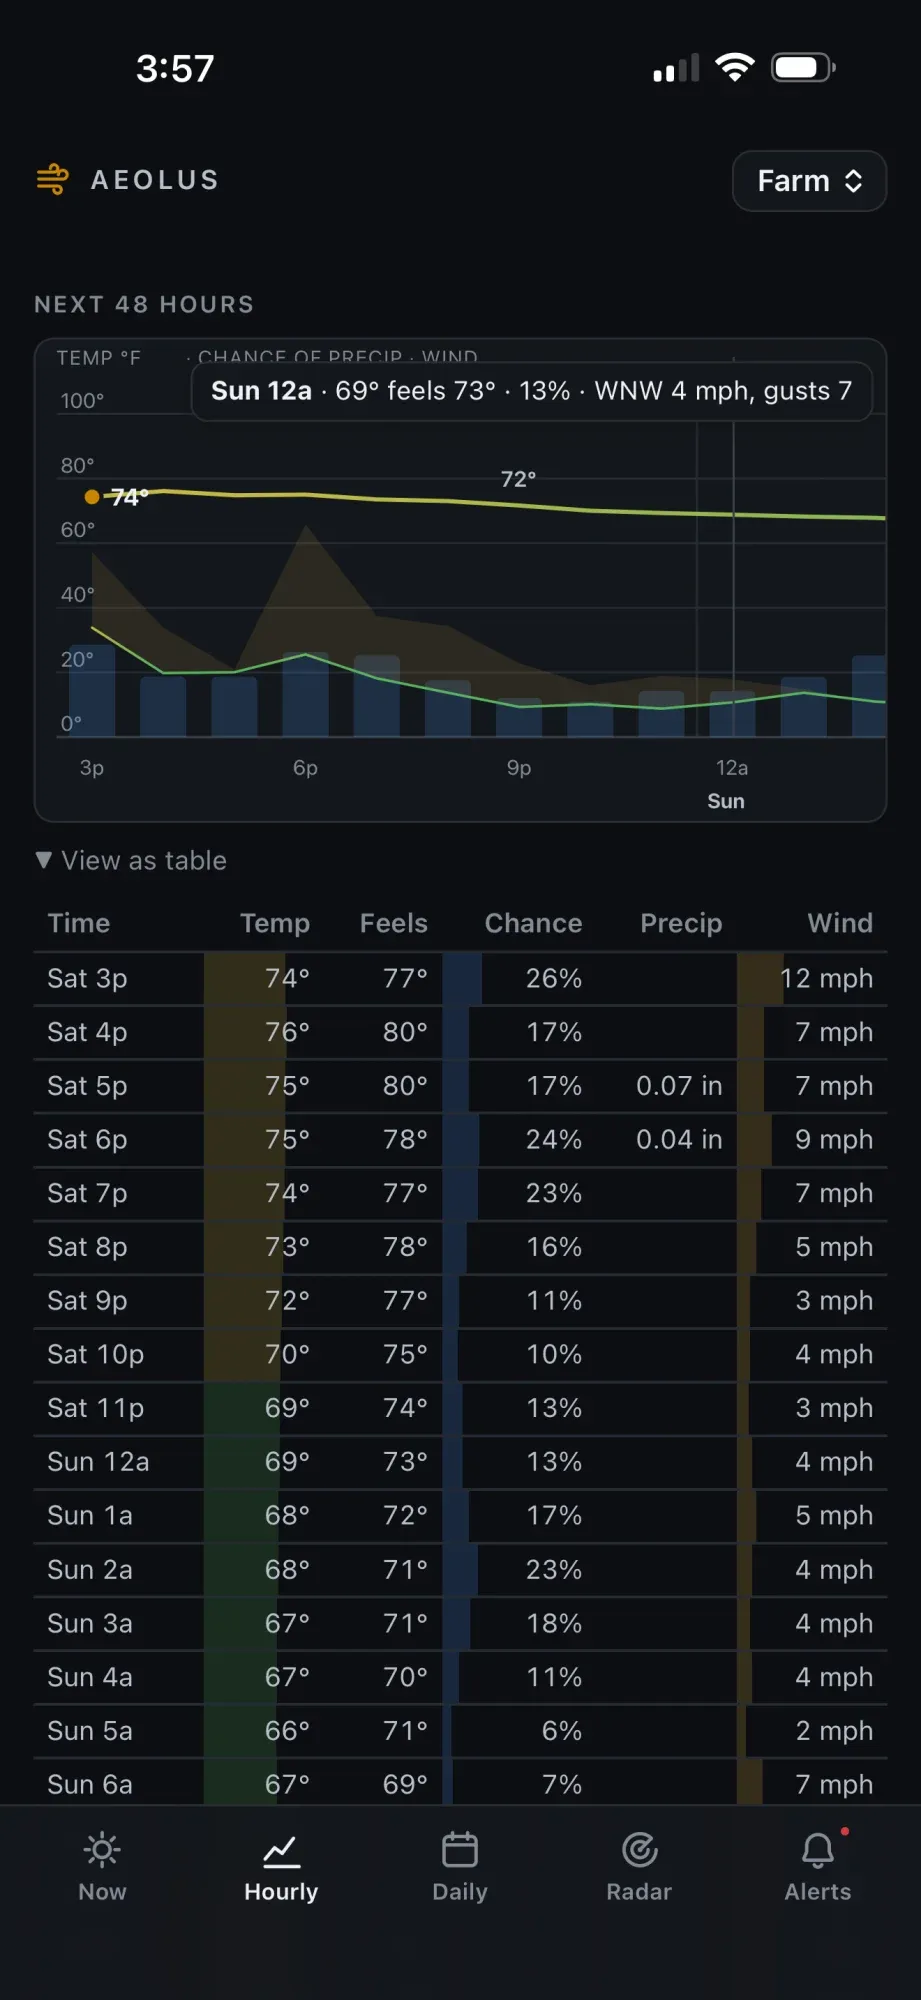
The 48-hour meteogram colors the temperature line by value on a fixed scale, layers precipitation-probability bars beneath it, and rides wind along a burn-safety gradient: green when calm, yellow at the open-burn threshold, red in red-flag territory, with a faint envelope showing gusts. The same data is available directly below as an open table. The color is not decoration. On a farm the real question wind answers is "can I light the burn pile," and a fixed color scale answers it at a glance with no second axis to read.
That grew into a proper burn-window feature, computed server-side so the verdict is consistent everywhere it appears. The server returns GO, CAUTION, or NO BURN from sustained wind, gusts, humidity, and any active fire-weather alerts. My defaults, all env vars so you can tune them to your own rules:
NO BURN at sustained wind at or above 15 mph, gusts at or above 25 mph, humidity at or below 25%, any active Red Flag Warning or Fire Weather Warning, or the combination of wind at or above 10 mph with humidity at or below 35%. CAUTION in the borderlands, or on a Fire Weather Watch. Missing data can never produce a GO; absence of information is treated as a reason for caution.
One distinction is pinned by tests: a heat warning does not block burning. A heat warning is not a fire-weather alert, and a naive "any active warning means no burn" rule would be wrong in a way that trains you to ignore the whole feature. Encoding judgment correctly matters more than encoding it at all, and a test keeps it correct.
The verdict looks ahead, not just at now. A 12-hour look-ahead produces "GO now, winds rise at 2 PM" instead of a bare current reading. The 7-day outlook evaluates each day over a 48-hour window, because brush piles here burn for two days: a calm day followed by a windy day correctly reads NO BURN, with the reason attributed to the second day. A green light on day one is worthless if day two is a wind event.
Radar over a self-hosted map
Radar is the meatiest part to build and the part where a naive approach quietly breaks. It arrived as version 2. Here is what a builder needs to know before starting.
The frames. NEXRAD composites come from Iowa Environmental Mesonet: public domain, no key, no published rate limit, timestamped immutable tile URLs on a 5-minute grid, with an archive that reaches at least a year back. That archive depth is what lets a 6-hour loop backfill instantly after a restart instead of slowly repopulating.
The gotchas, in the order they will bite you:
The tile path looks like TMS but the y-axis is XYZ/slippy. Get this wrong and your radar is flipped and you will waste an afternoon.
Blank tiles return as HTTP 200 PNGs, not 404s. So "did this tile load" cannot be a status-code check; you have to decode the PNG and reject any tile with no non-transparent pixels. Success detection that trusts the HTTP status will happily cache and animate a loop of blank frames.
The catalog only advertises the current frame. Historical layer names are not listed, so you construct them yourself on the 5-minute grid.
Use their /c/ cache prefix (it sends 14-day cache headers) and pace politely: about 5 requests per second maximum during a one-time backfill, with a descriptive User-Agent carrying a contact email. Public-domain and no-published-limit still means be a good citizen.
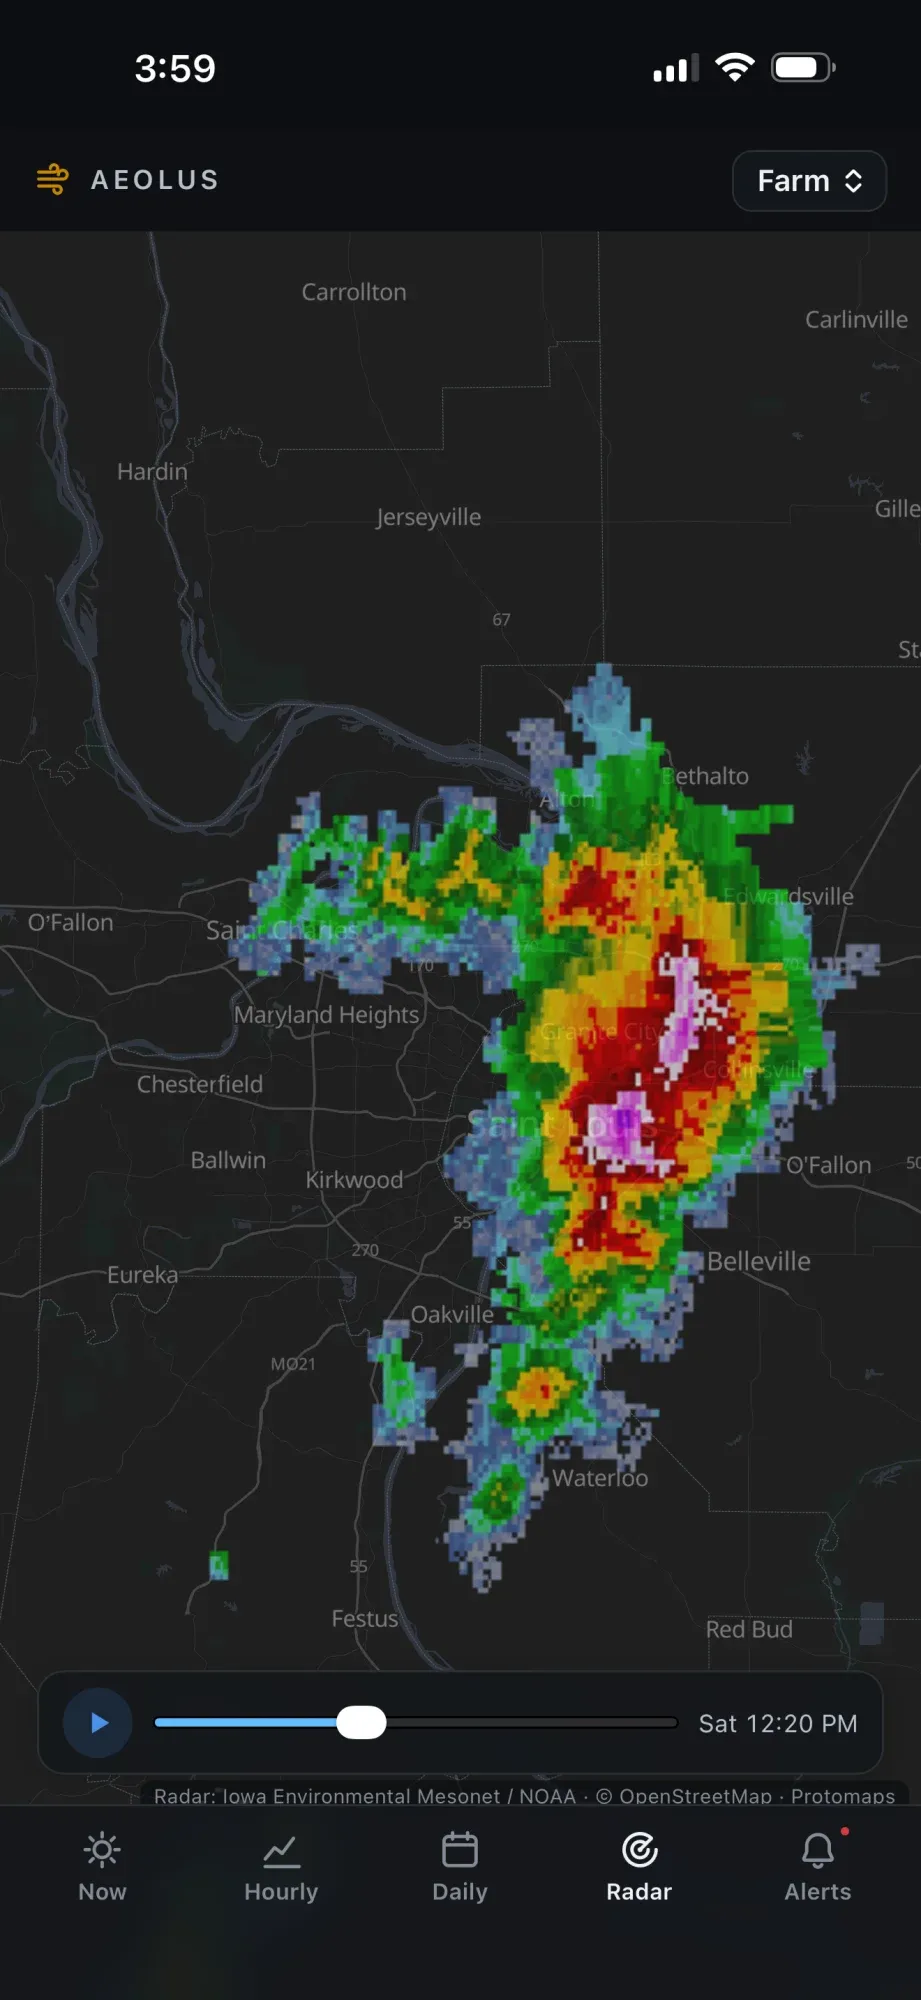
How the service handles frames. It warm-fetches each new frame's tiles for the home area, then serves them through its own proxy with immutable cache headers, so phones scrub the animation for free off the local cache. It keeps a 6-hour loop (about 72 frames) and prunes older ones, with a 30-minute grace window: a just-pruned frame that a phone still asks for is re-fetched on demand from the deep archive rather than showing a hole. After a restart it backfills the whole loop immediately. A fallback path sits behind the same abstraction: nowCOAST WMS serving MRMS mosaics at about a 4-minute cadence, so a single upstream problem does not take radar down.
The basemap is self-hosted too. A single Protomaps extract (one .pmtiles file, about 165 MB for a multi-state storm region at maxzoom 12) is generated with pmtiles extract (from go-pmtiles) against Protomaps' free daily planet build. The extract does range reads and pulls only the region you ask for, so it finishes in about 10 seconds. The app serves that file itself with HTTP Range support, and a vendored copy of MapLibre renders it, with Protomaps' basemap style JSON plus its font glyph PBFs and sprite sheet vendored alongside so the map renders fully offline. No CDN, no external tile server. Re-extract quarterly to stay current. Active warning polygons draw over the radar straight from the service's own alert store.
Radar here is deliberately past-only. Free forecast radar died with RainViewer, and the numeric nowcast already covers the next hour. A future radar loop would just be a guess presented as data, so there is not one.
The PWA: works on a dead connection
The whole front end is a self-contained progressive web app with zero CDNs. MapLibre, fonts, and sprites are all vendored. It is installable to a phone home screen. A service worker serves the app shell cache-first and API data network-first with a cache fallback. The client uses the same cache-first approach as the server, so on a dead connection it shows the last known data with staleness badges instead of a blank screen.
Reaching it from anywhere: the tunnel
The family needs the app from anywhere, not just on the home WiFi, and I was not going to open a port at home to get that. Many rural, fiber, and 5G connections sit behind CGNAT and cannot port-forward at all even if you wanted to. The pattern I use solves both problems and is worth copying.
Pangolin is an open-source self-hosted tunneled reverse proxy. It runs on a cheap VPS (about $5 a month) with a wildcard DNS record and automatic Let's Encrypt certificates. At home, a lightweight agent container called newt runs in the same Docker Compose stack as the weather app and maintains an outbound tunnel to the VPS. Because the tunnel is outbound, nothing at home listens on a public port, and CGNAT is irrelevant.
In Pangolin's dashboard you create a "resource": a mapping from a subdomain to a container-name:port on the home side. Pangolin enforces authentication (SSO or per-resource credentials) before any request reaches the home network. Publishing the weather app took one resource entry pointing at its container, because the newt tunnel was already up serving other family apps. The PWA then installs to phones directly from that authenticated public URL.
Two honest caveats. The first time you add the subdomain, the certificate waits on DNS propagation, so it is not instant. And the VPS is a second machine you now have to keep patched.
Alternatives worth knowing, one line each: Cloudflare Tunnel is the easiest to stand up, but a third party terminates your TLS. Tailscale is excellent for private family use but gives you no public URL without Funnel. Plain WireGuard plus a reverse proxy is the most manual but the most fully yours. I picked Pangolin because I wanted a real public URL behind my own auth, on infrastructure I control, and I already had the tunnel running.
What it runs on and what it costs
The hardware demands are almost embarrassing to state. One Flask container (gunicorn, 2 workers) with SQLite, idling at about 125 MB of RAM and 224 MB of disk total, and that disk figure already includes the self-hosted basemap and six hours of cached radar imagery. A compose healthcheck hits /healthz. Nightly backups run sqlite3 weather.db ".backup out.db" (or VACUUM INTO), never a raw cp, so a backup never catches a mid-write file. Mine shares a small home server with a dozen other services. Any spare machine you already own runs this; the idle footprint is small enough that a modest single-board machine would likely handle it.
Data cost is $0 a month: Open-Meteo, Pirate Weather's free tier, NWS, Iowa Environmental Mesonet, nowCOAST, and Protomaps are all free public sources, all attributed in the app. The only real spend is the VPS for remote access, and if you already self-host anything publicly, you likely already have it.
Total build time was roughly 30 hours from design doc to animated radar. I built it by directing fleets of AI coding agents: I designed, decided, and reviewed; the agents wrote, tested, and deployed. By the end there were 171 server-side tests and 89 UI checks guarding it. The tests are not ceremony. They are what pins decisions like "a heat warning does not block burning" so a later change cannot silently undo the judgment.
Launch day and the shakedown storm
Two events validated the design better than any amount of planning.
On launch day, Open-Meteo went unreachable during the deploy, at the exact moment I was watching. The architecture did what it was built to do: Pirate Weather served every endpoint with fresh data through the same canonical schema, and nobody looking at the service would have known anything was wrong. The same day, a real heat warning flowed cleanly through the entire alert pipeline, from NWS poll to Slack. The payoff compounded later: I pointed the family wall dashboard at this service's API, and its weather card can no longer go blank when an upstream dies, which is exactly what it had done that morning when it still hit a provider directly.
The radar's first real storm, the next morning, was its shakedown cruise, and three bugs surfaced at once. An error banner blamed the basemap for what were actually radar-tile hiccups. The server pruned its oldest frame while phones were still holding a slightly stale frame list, producing blank flashes. And the animation advanced on a fixed timer instead of waiting for tiles to finish loading. All three came out of a single screenshot: an error banner sitting on top of a perfectly rendered map. The banner fix was to attribute errors correctly. The blank-flash fix was the 30-minute grace window, re-fetching a just-pruned frame on demand, which is only possible because that upstream archive is so deep. The animation fix was to advance on load, not on a clock. One good screenshot was worth more than any log.
Takeaways
If you build one of these, start from the cache and let everything else follow from it. Normalize every source into one schema before it reaches your UI, so failover is invisible. Poll each upstream at its real update rate, no faster. Annotate alerts instead of filtering them, and dedupe on VTEC keys, not message ids. Badge stale data rather than hiding it. Reach it from anywhere with an outbound tunnel so you never open a port. Owning the cache is what makes the service reliable; the app it replaces depended on upstreams it did not control.
I doubt the code itself is of much interest, since the value is in the decisions above. But if you want it, say so in the comments and I will get around to abstracting a version anyone could run.
Comments
// Comments are reviewed before appearing. No spam. No noise.