Almost everything you buy works this way. The gauge on the front shows you four numbers. The machine behind it is measuring a hundred. That is not a trick, it is just how things get built: the maker picks a tidy little display and moves on, because four numbers are what most people want. You paid for all hundred anyway. You usually only ever see four.
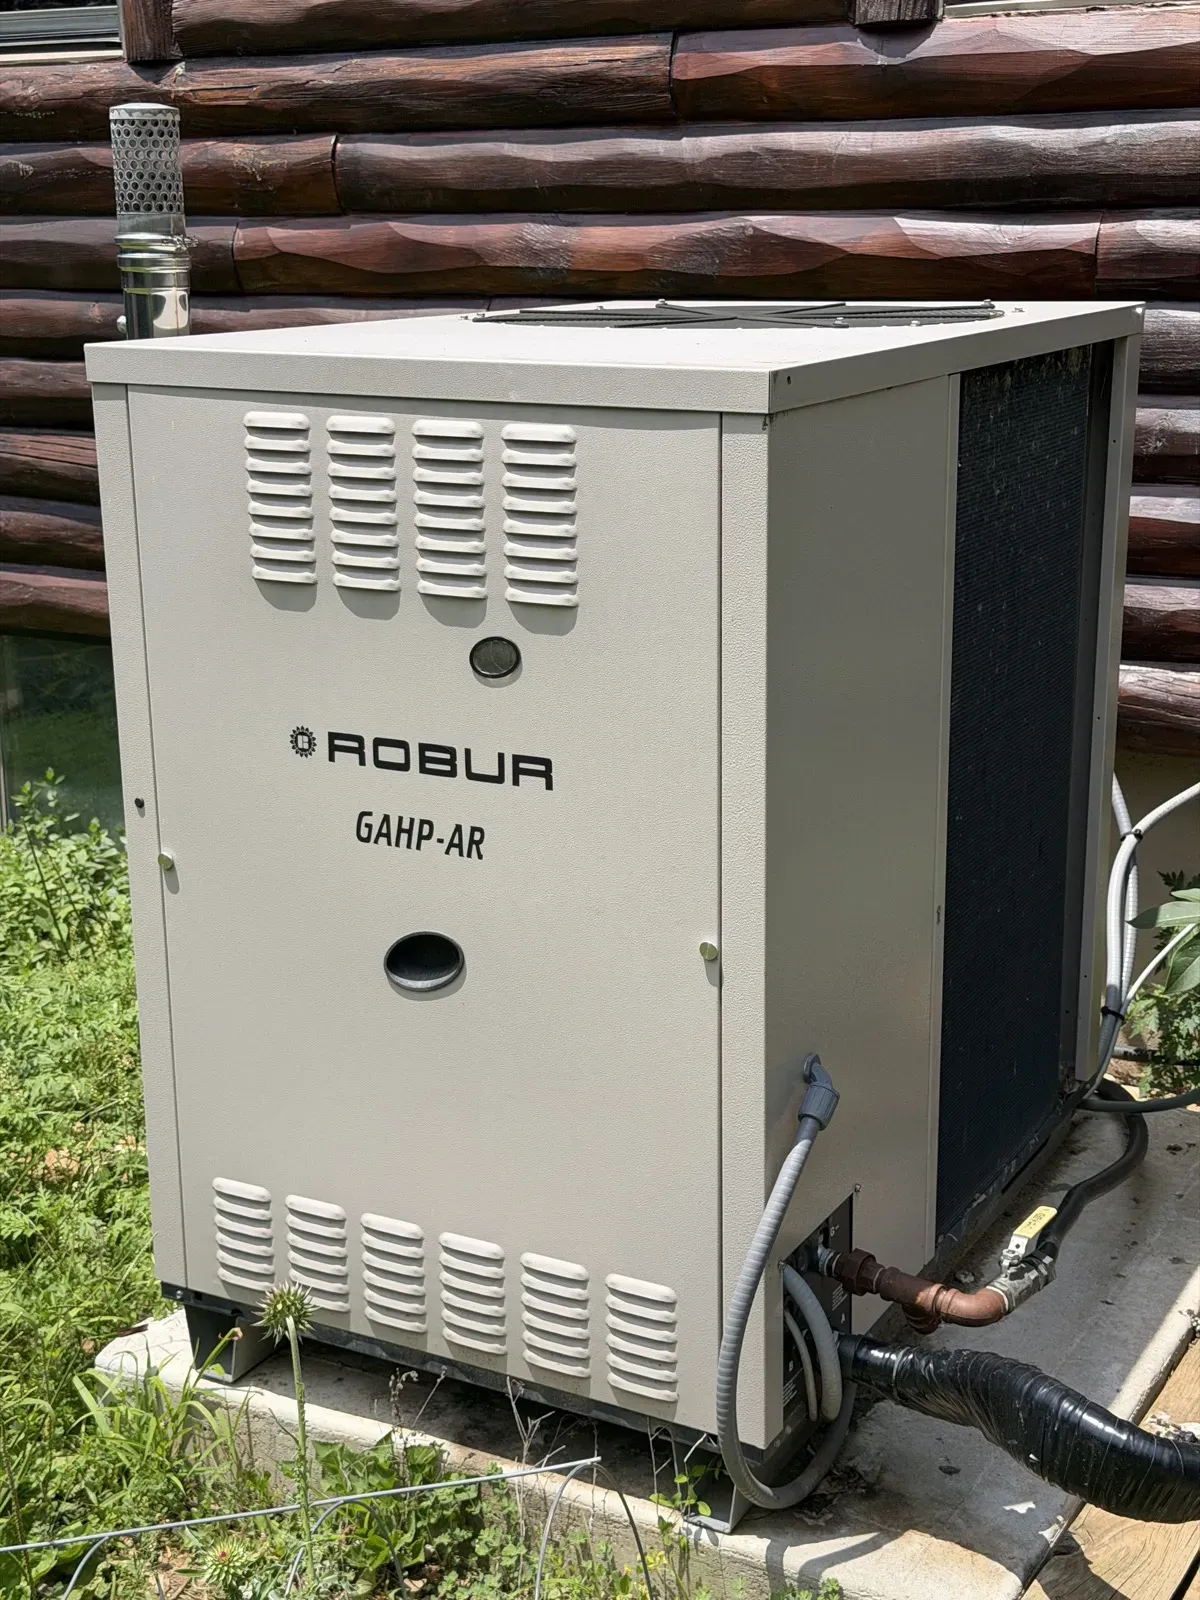
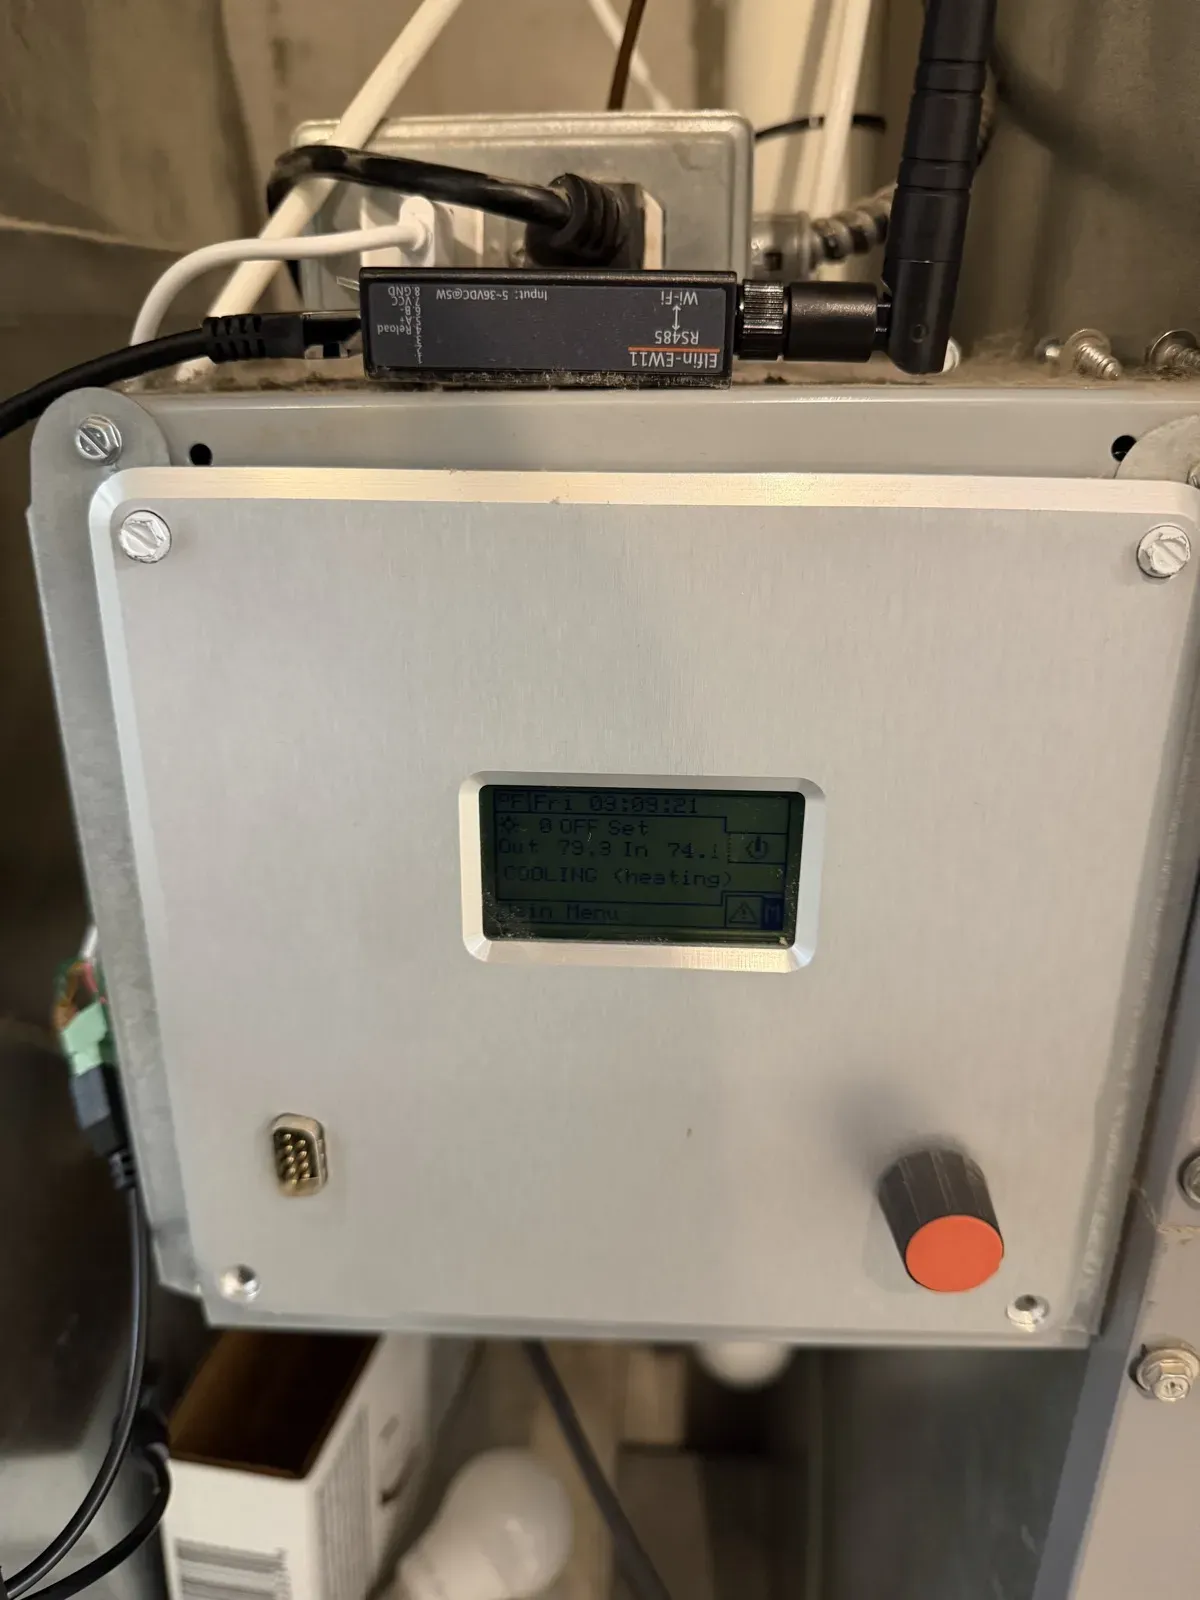
I have two Robur GAHP-AR gas absorption heat pumps, one under the shop and one under the house. They are strange, wonderful machines: they burn natural gas to drive an ammonia absorption cycle and pull heat out of cold outdoor air, which is why a good one delivers more heat energy than the gas it burns. The R in GAHP-AR is for reversible: the same unit runs the cycle backward to air condition, driven by gas instead of a big electric compressor, which cuts my electric bill by roughly two thirds in cooling season. Robur discontinued the line in 2025, which makes mine exactly the kind of thing worth keeping alive and understanding deeply. Each one is run by a Robur DDC controller: a sealed box with a thumbnail-sized monochrome screen that shows me, on a good day, the water temperature and whether it is heating.
Behind that screen the DDC is tracking inlet and outlet temperatures, generator and condenser and evaporator temperatures, solution pump speed, flame state, defrost cycles, every alarm code, and a hundred other things. I paid for all of it. I wanted to see all of it. So I did, and the gear I already owned is now smarter to me than it ever was to its own front panel.
The capability was already there
Here is the nice surprise about "smart" anything. The instinct, when you want data off a machine, is to buy a new gadget that bolts on and measures from the outside. A clamp here, a probe there, another cloud subscription. But the machine already has the sensors. It has to; it cannot run the cycle without them. The data exists. The only question is whether the manufacturer left you a door.
Robur did. The DDC speaks Modbus, the boring old industrial protocol that has been running factories for forty years, over an RS-485 serial bus. The full register map is a 69-page document Robur provides on request. This is the important nuance: I was not breaking in. The interface is documented and supported. It is simply not meant for a homeowner with a weekend and a soldering iron; it is meant for a building-automation contractor wiring a commercial plant. The capability ships in the box. Not many owners open that door.
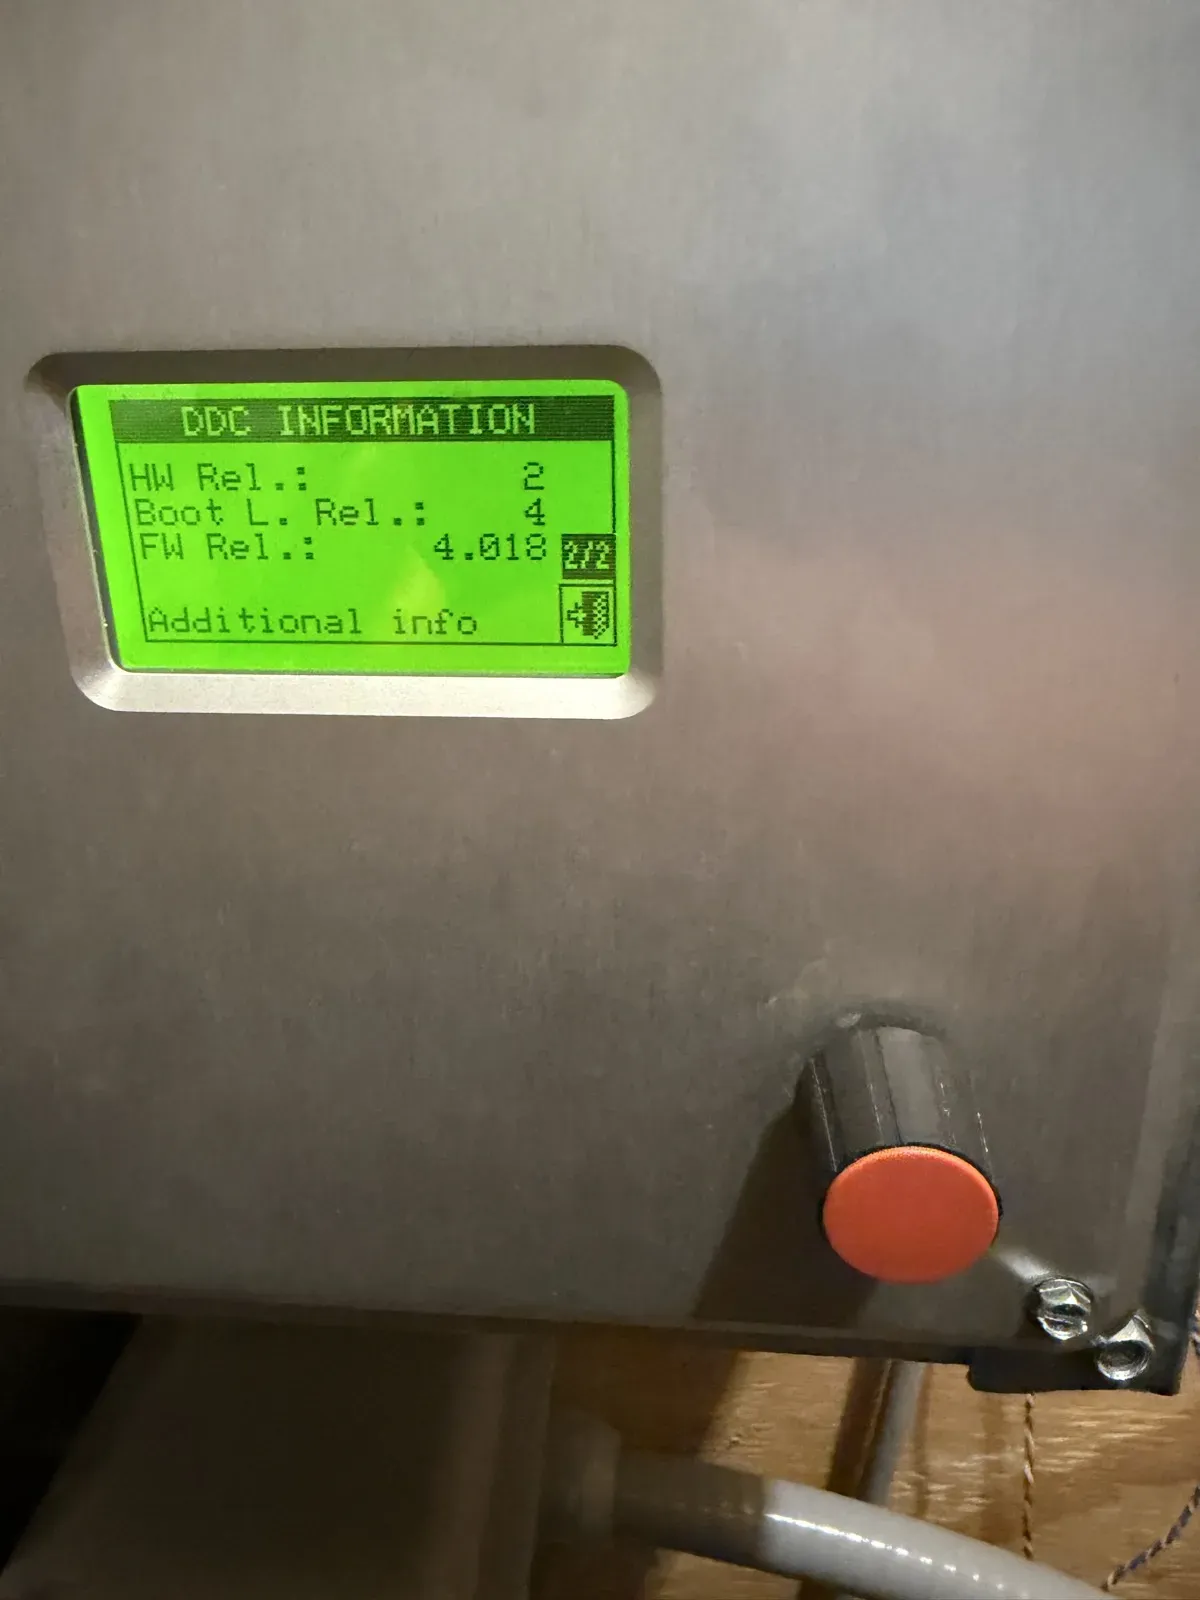
The register map is tied to one specific firmware version. Mine read 4.018. You confirm it by reading two registers, 30004 and 30005, which come back as 4 and 18. So you keep the controller off auto-update, because a firmware bump would shuffle the map and silently turn every reading into garbage. For my purposes, the version of this machine I want is the one frozen where it is.
Reading is the easy half. I want to write.
Right now this only reads. The poller asks questions and never gives orders, which is plenty for watching, but it is not where I want to end up. I want to change a setpoint from the dashboard, not just admire it. Honestly I was surprised that writing was not simply there out of the box, because the controller speaks Modbus in both directions; the door swings both ways. Pushing values back in runs through the DDC's own remote-management mode, and that is the next thing I am building. For now it reads. Control is the part I am actually after.
Simulate before you wire
Here is the discipline that made install day boring, and boring is what you want from an install day. I built the entire software stack and tested it against a fake heat pump weeks before I touched a real wire.
I transcribed all 1169 registers from the protocol document into a machine-readable map, wrote a small simulator that pretends to be a DDC speaking Modbus (including a scenario that fakes the exact failure I most wanted to catch), and pointed the real data pipeline at the fake. By the time I drove out to the mechanical room, the poller, the database, the dashboards, and fifteen alert rules had all been validated end to end against a machine that did not exist yet. The only unknowns left were physical.
The wiring, and two things that went wrong
The link from each heat pump to my network is deliberately simple and deliberately wireless between buildings. An Elfin EW11, a thumb-sized WiFi-to-RS-485 bridge, sits on a short serial stub at each DDC and presents the Modbus connection over WiFi as plain TCP. No copper runs between the shop and the house, ever; that way lies ground loops and lightning. Two buildings, two gateways, two independent buses. Both controllers are happily Modbus address 1, because each is alone on its own wire.
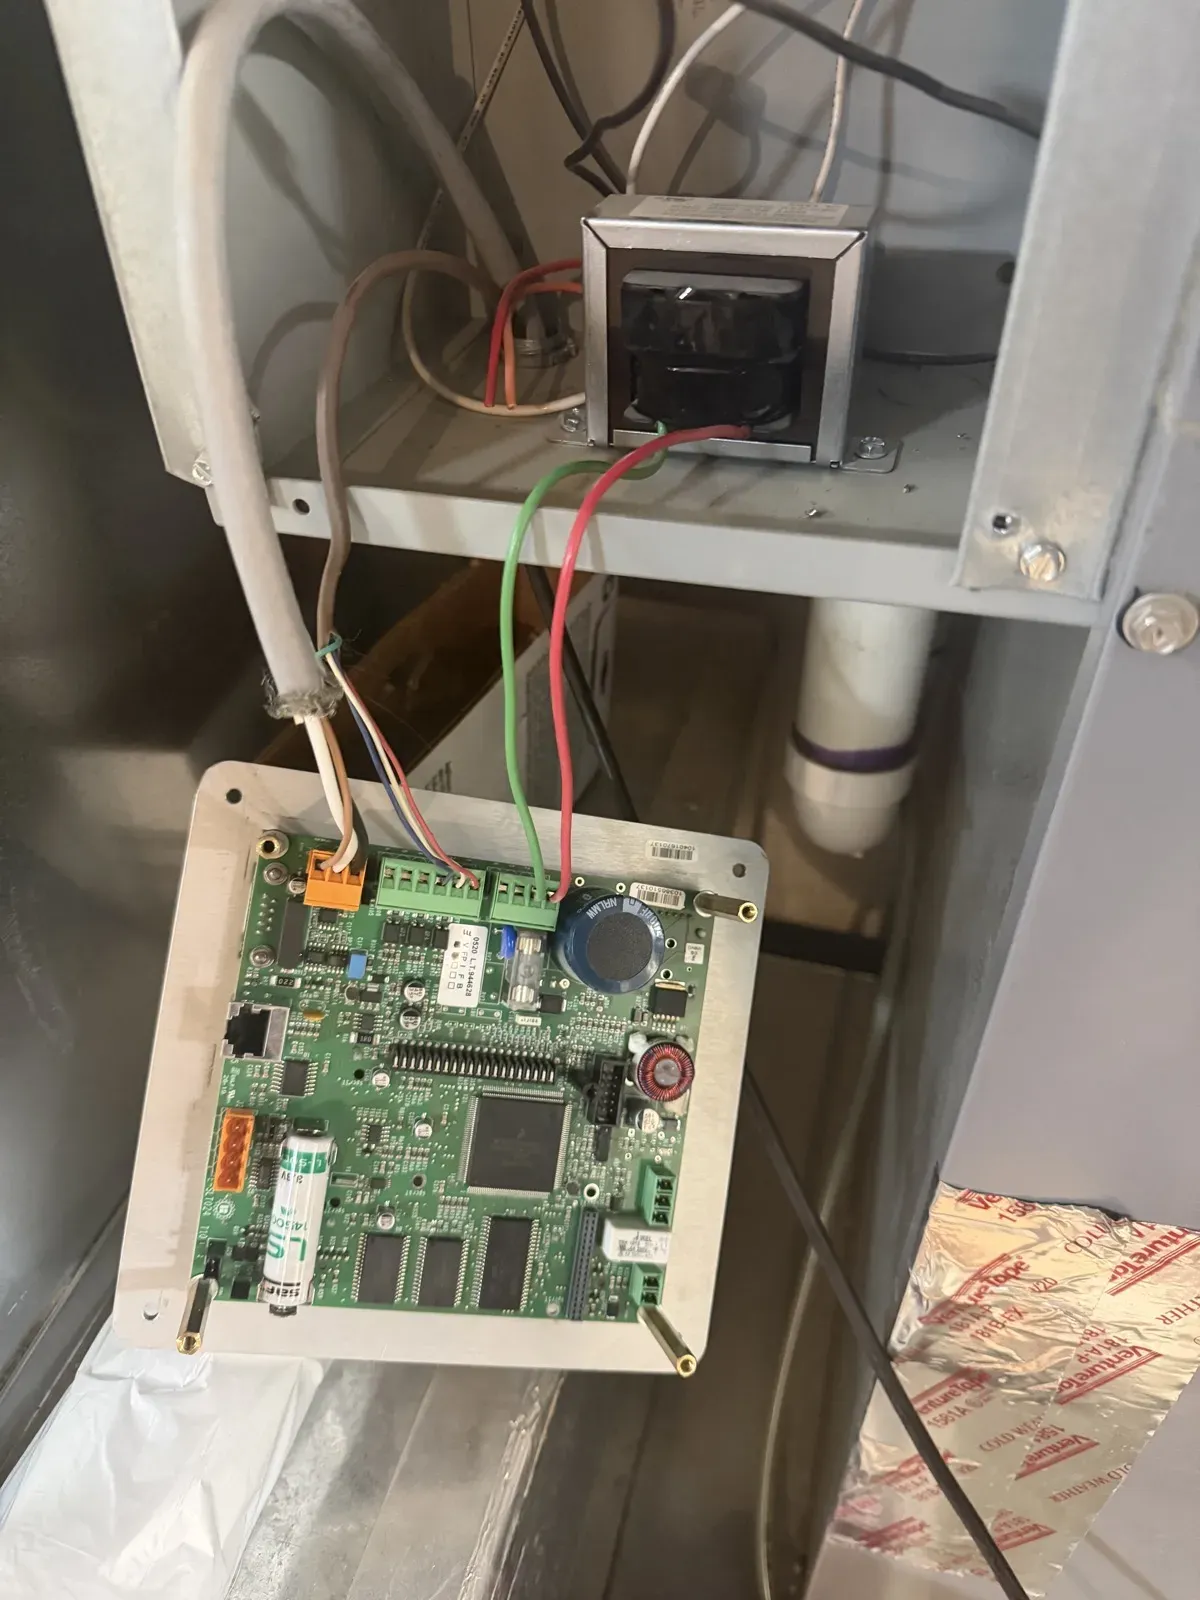
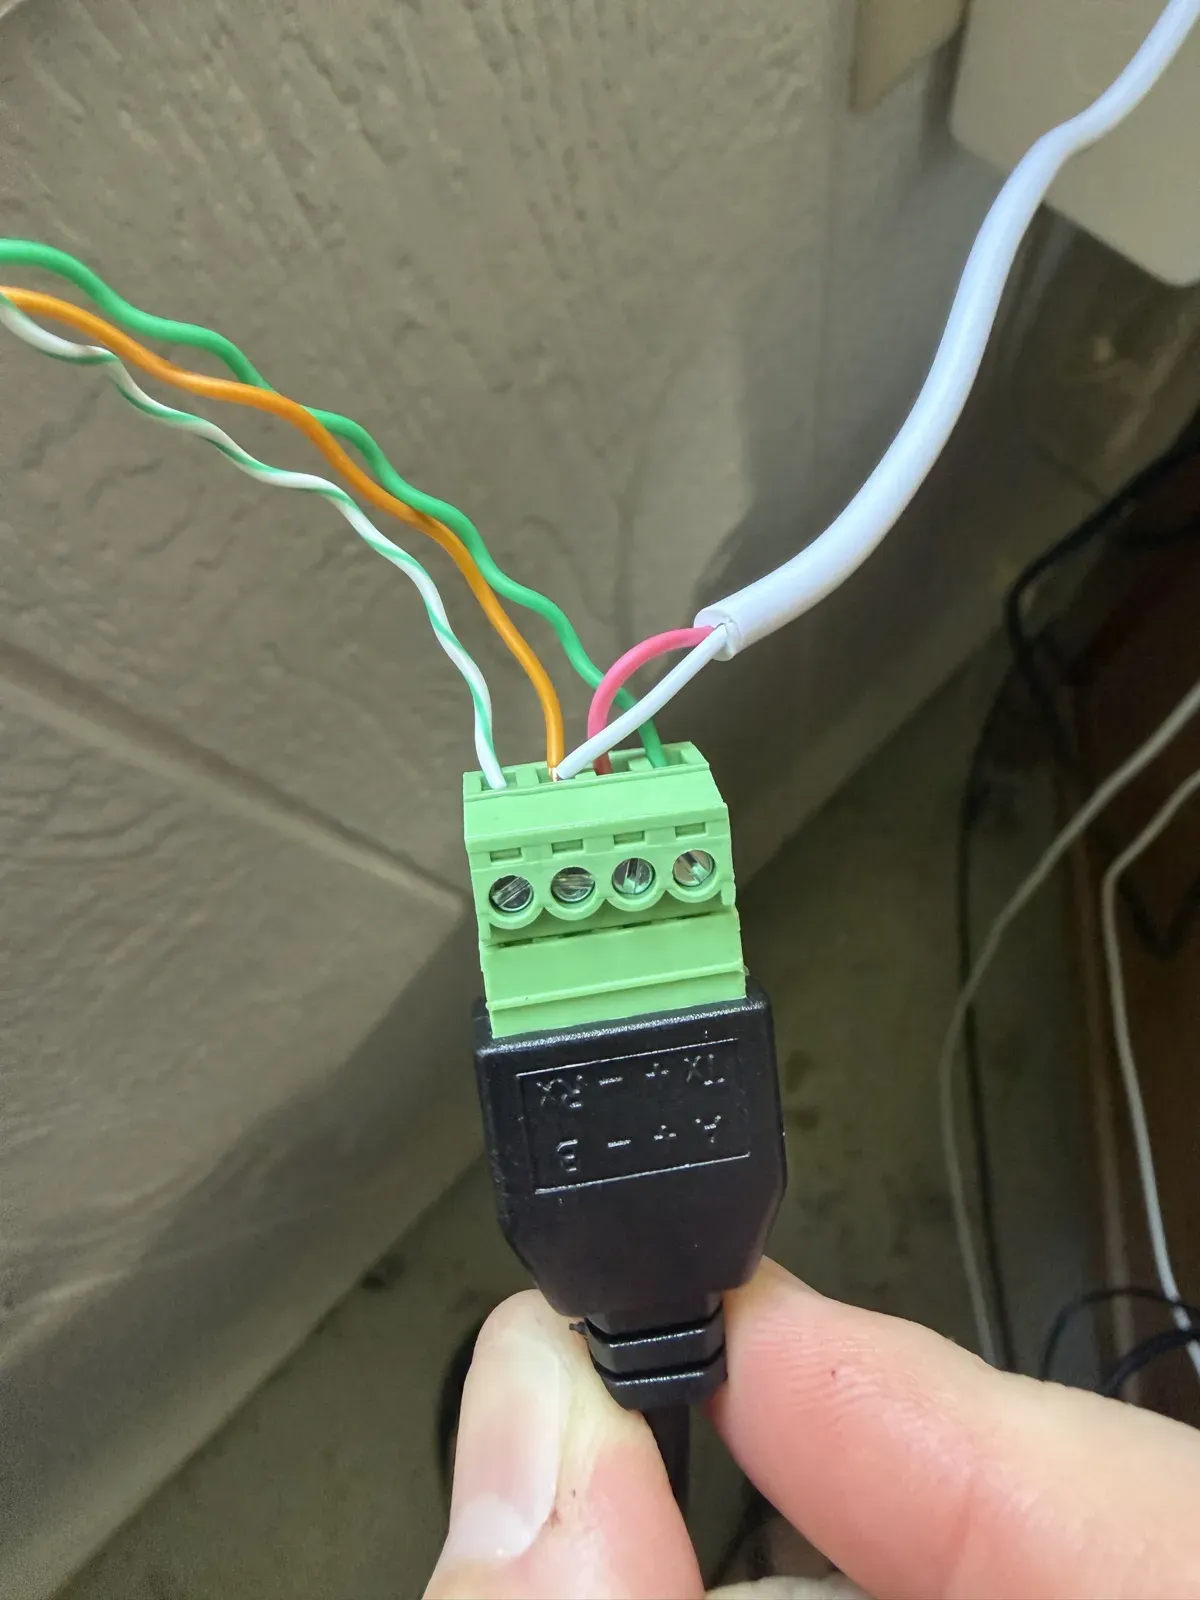
The RS-485 port on the DDC is a four-pole connector called J2. A length of Cat6 carries the signal: one conductor to A, one to B, one to common, and the drain to the shield pin.
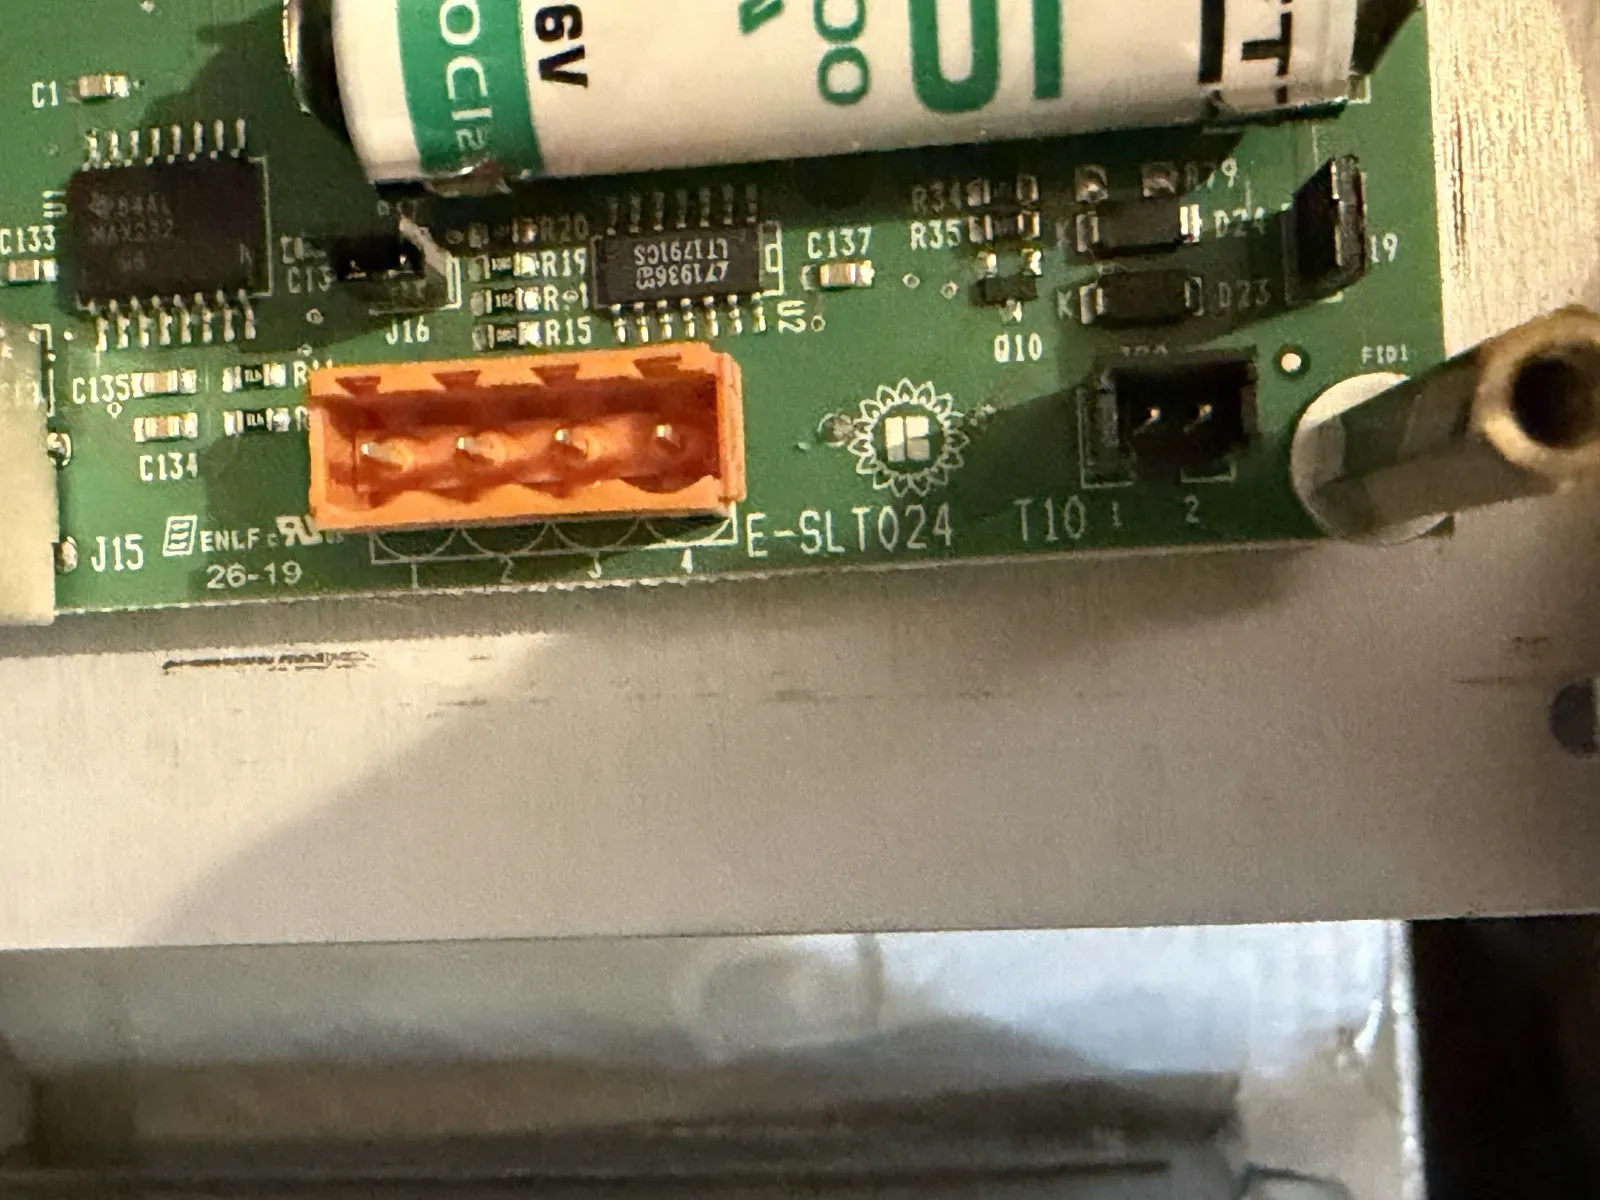
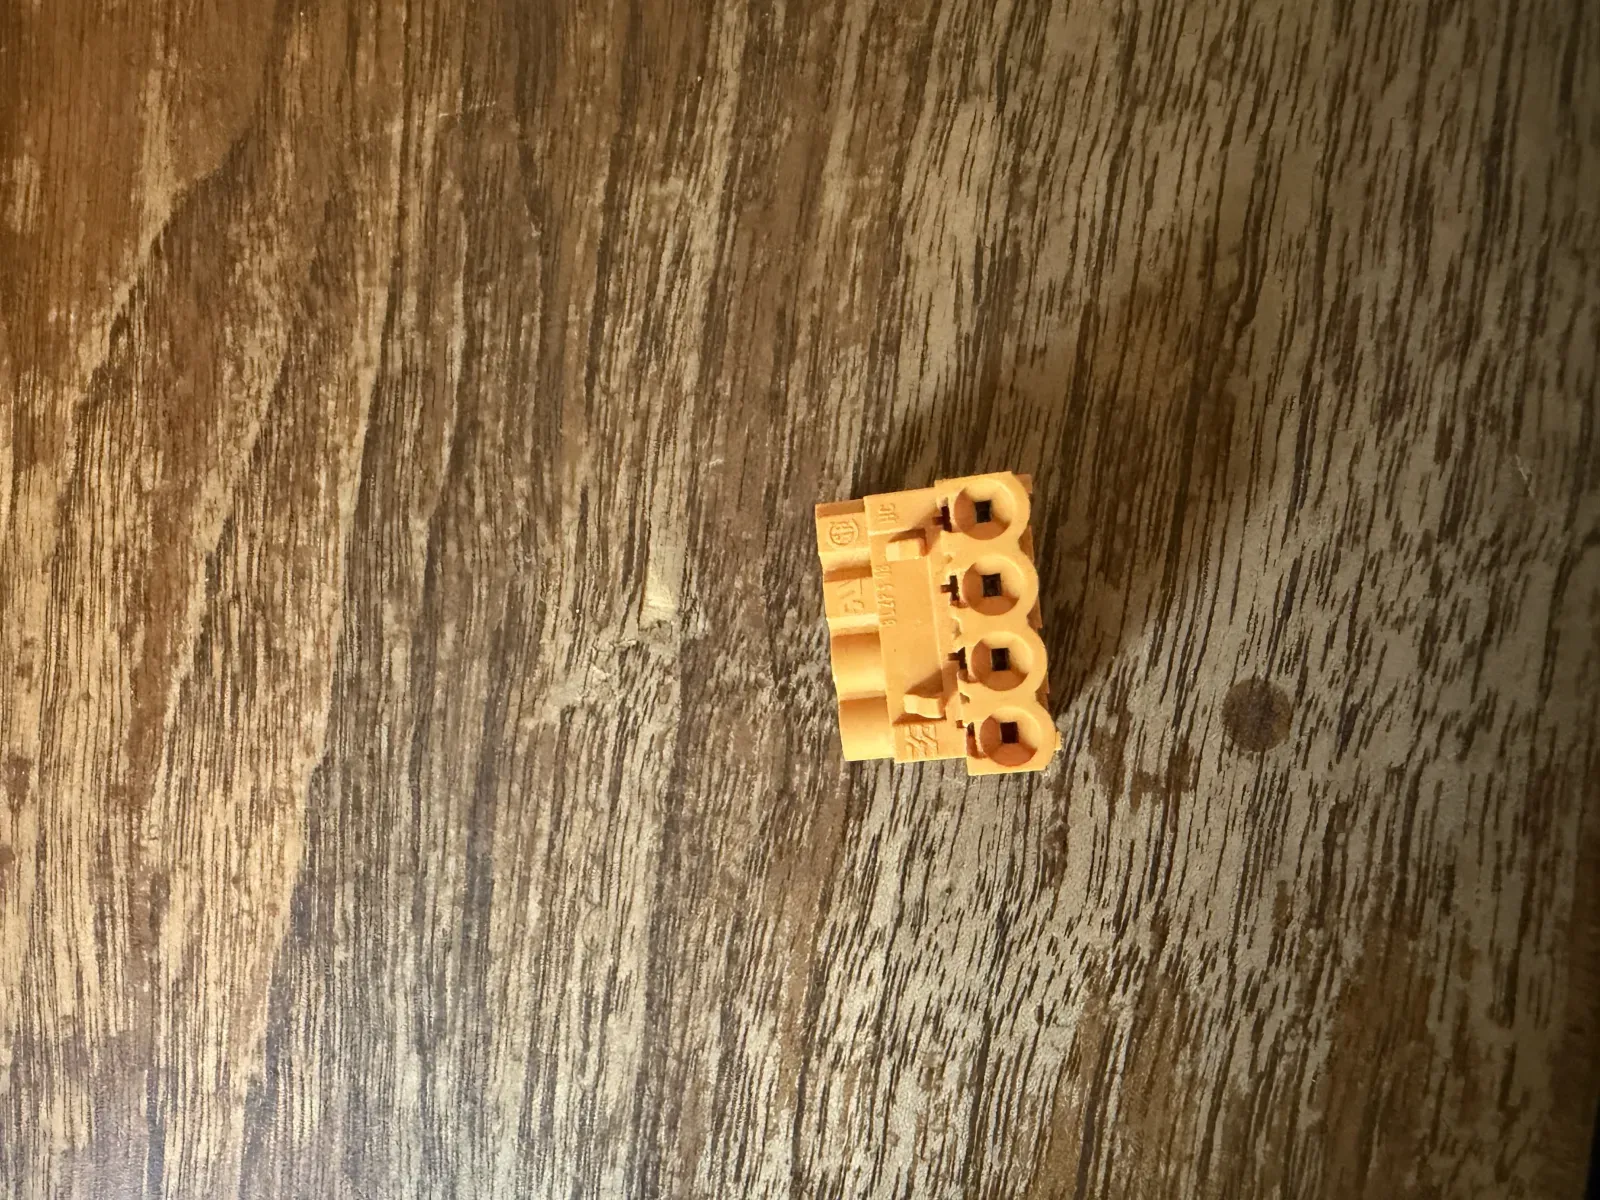
Two things went wrong. First, the mating plug for J2 was missing. It ships with the unit, but a careless installer had misplaced mine, so the port was there and the plug to connect to it was not. Work stopped until a replacement arrived, about thirty dollars and a few days.
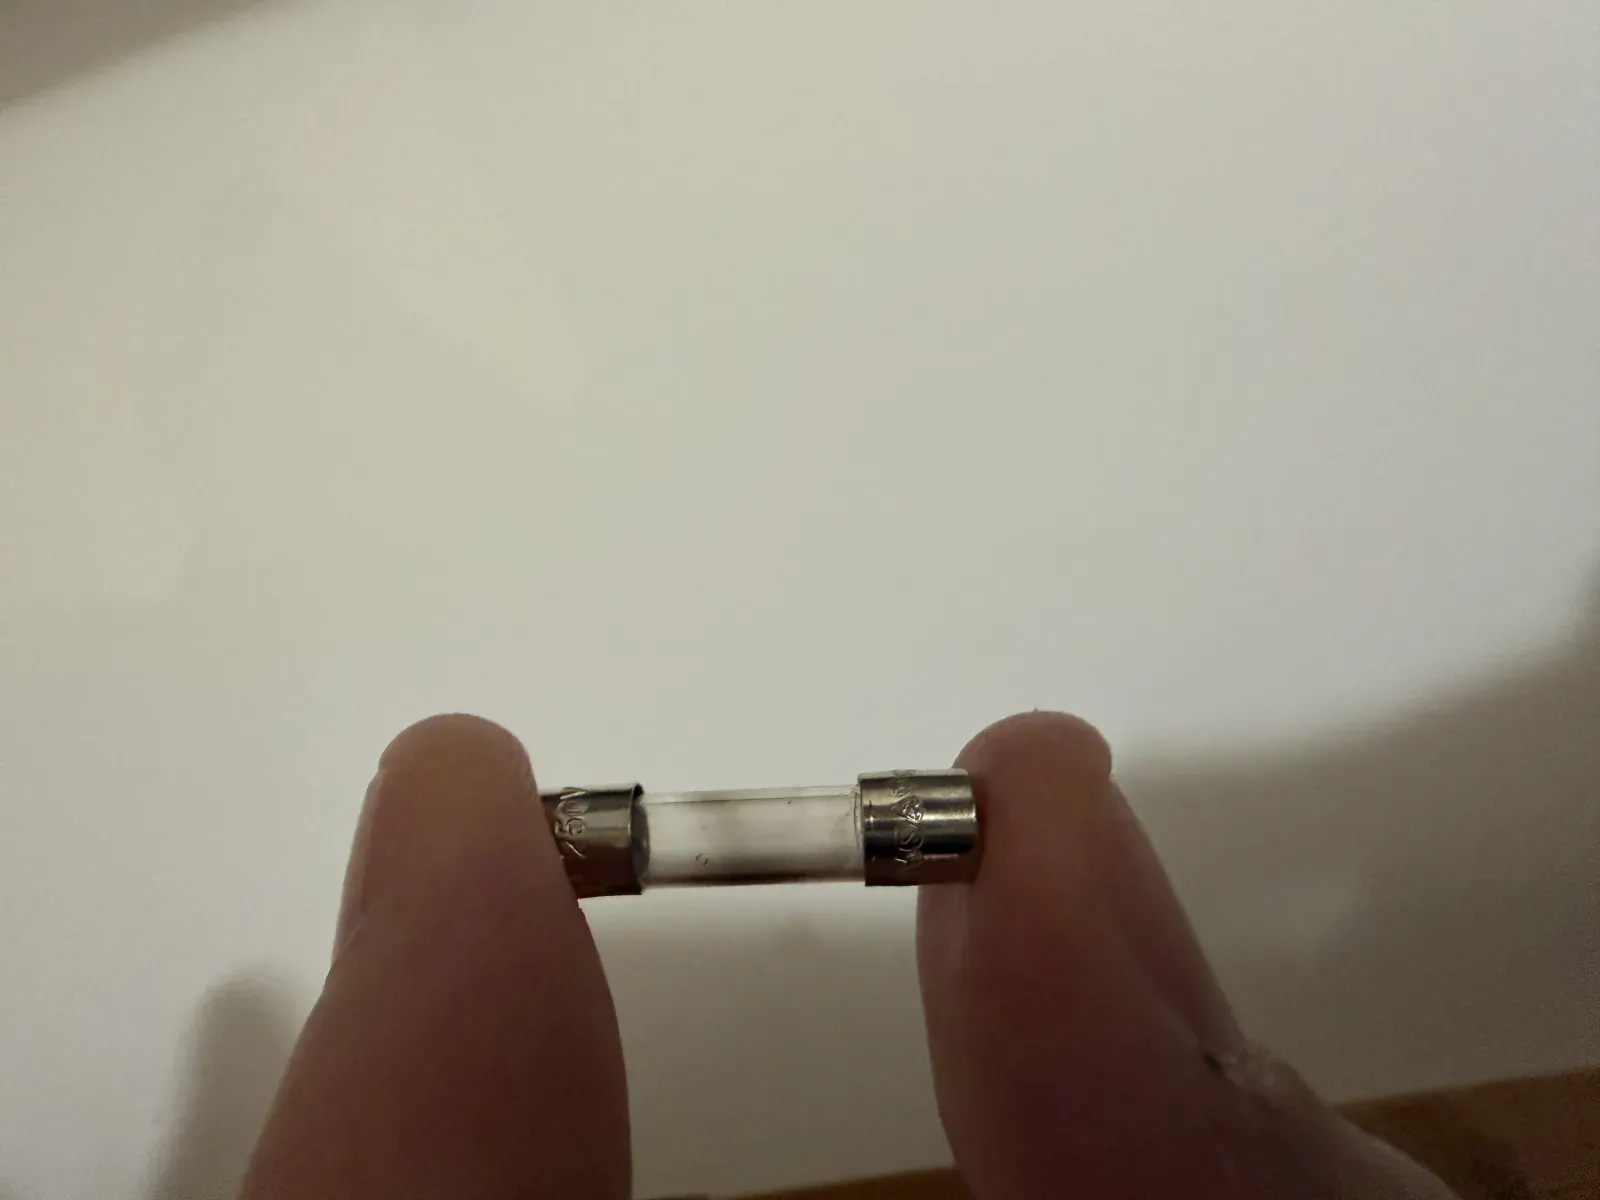
Second, while the controller was out for wiring, its onboard fuse popped. There is a special flavor of stomach-drop when a discontinued controller goes dark in your hands. It turned out to be exactly what it looked like, a tired little glass fuse, reseated and back to life. But for one long minute I was certain I had killed an irreplaceable board.
Then the moment it was all for. With the plug wired and the gateway joined to WiFi, I ran a single test query and asked the controller its firmware version through the entire chain: controller to RS-485 to the WiFi bridge to my laptop. It answered 4 and 18. The map matched. Everything I had built against a simulation was about to meet the real machine, and the gate was clear on the first try.
What you actually get
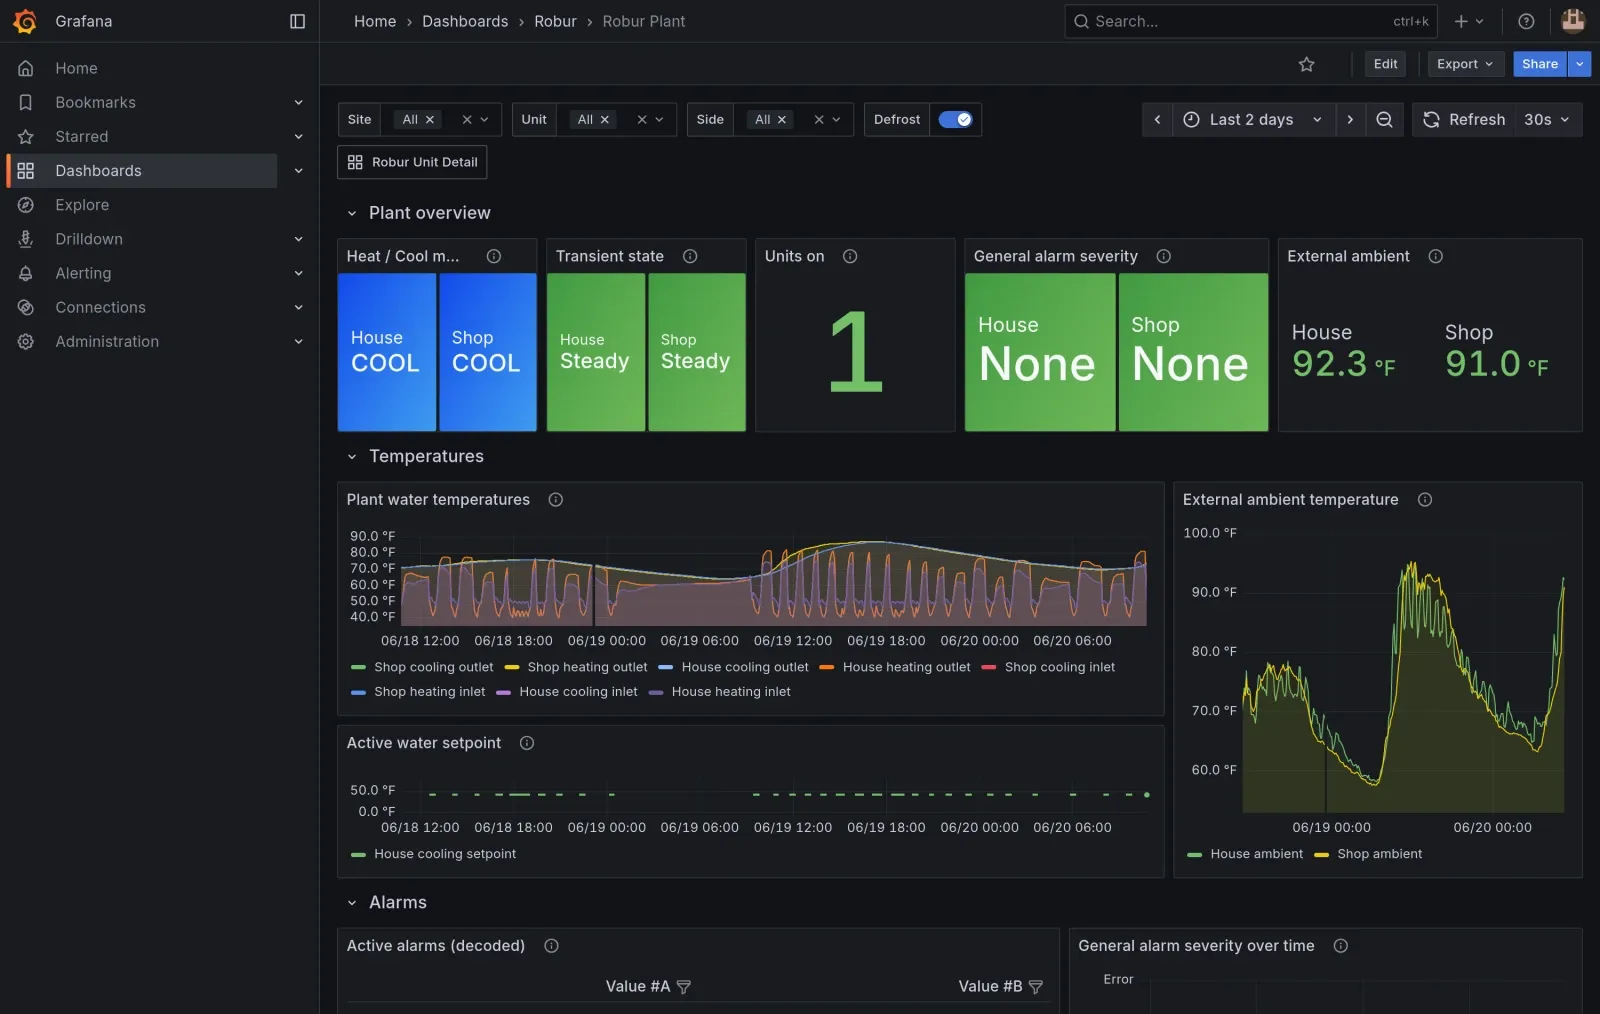
A poller queries each gateway and feeds a time-series database; Grafana draws it and, if anything looks wrong, an alert manager shouts into Slack. The same boring, bulletproof stack that watches my servers now watches my heat.
The plant overview is the at-a-glance view: both machines, their mode, whether any alarm is active, the water temperatures, the outside air. The most satisfying thing on it is the row of green that says, in plain language, that every one of more than a hundred possible fault codes is currently clear. Healthy, both buildings, in one glance.
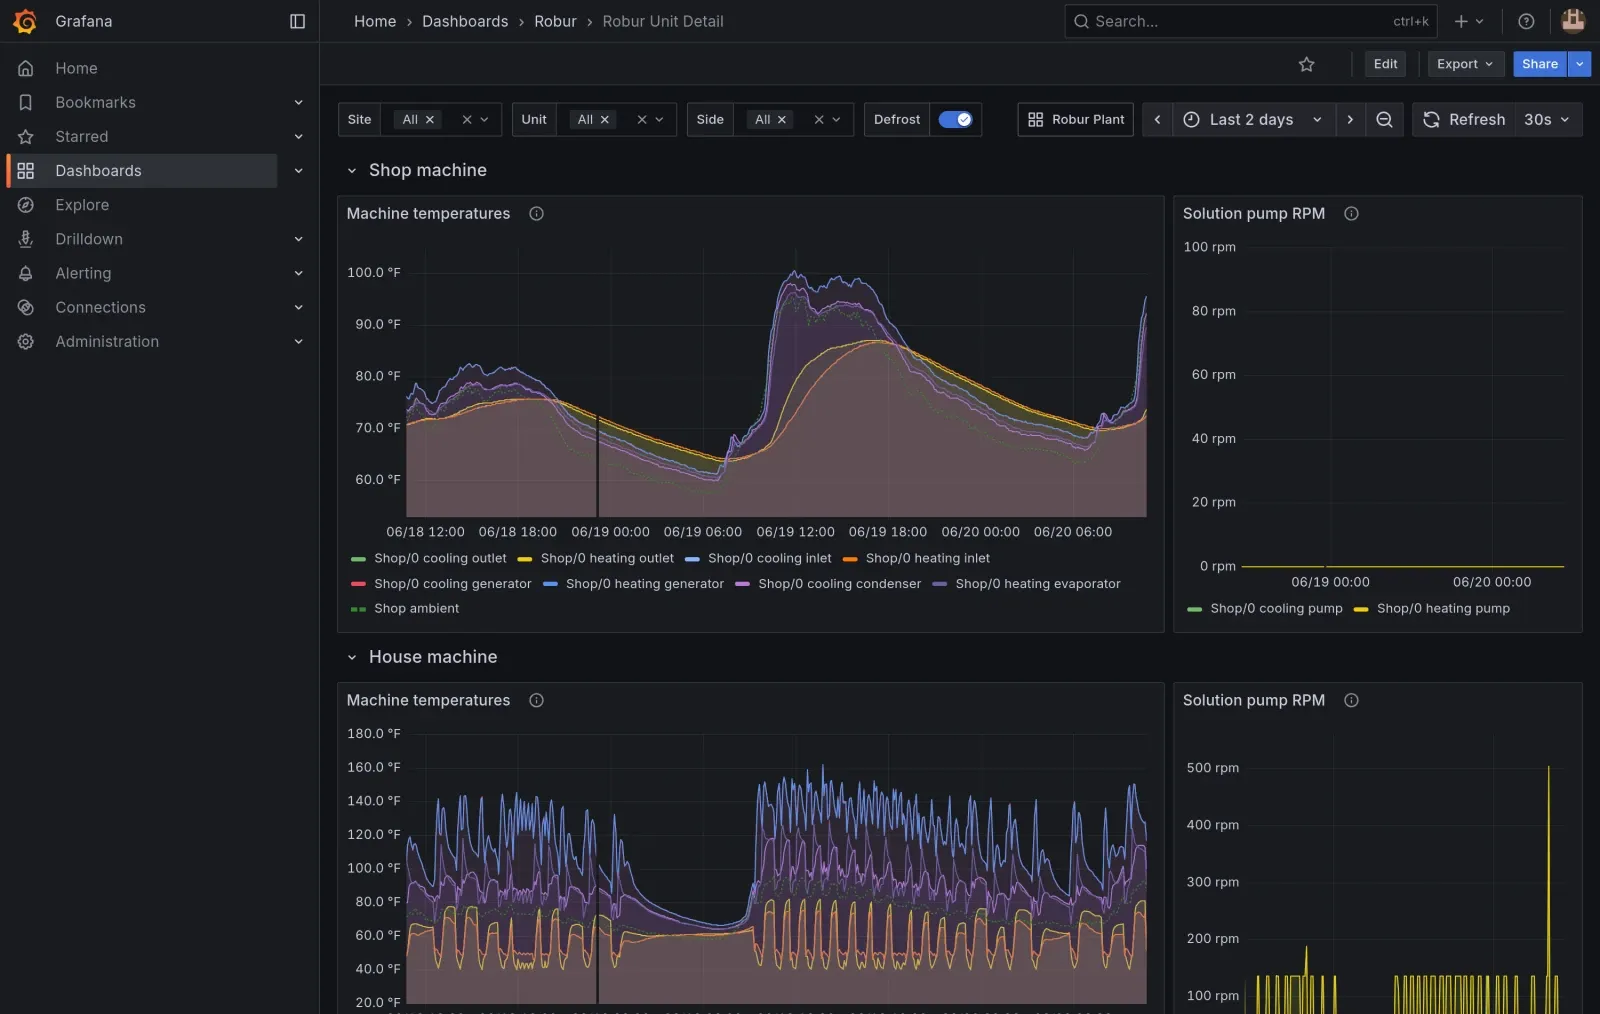
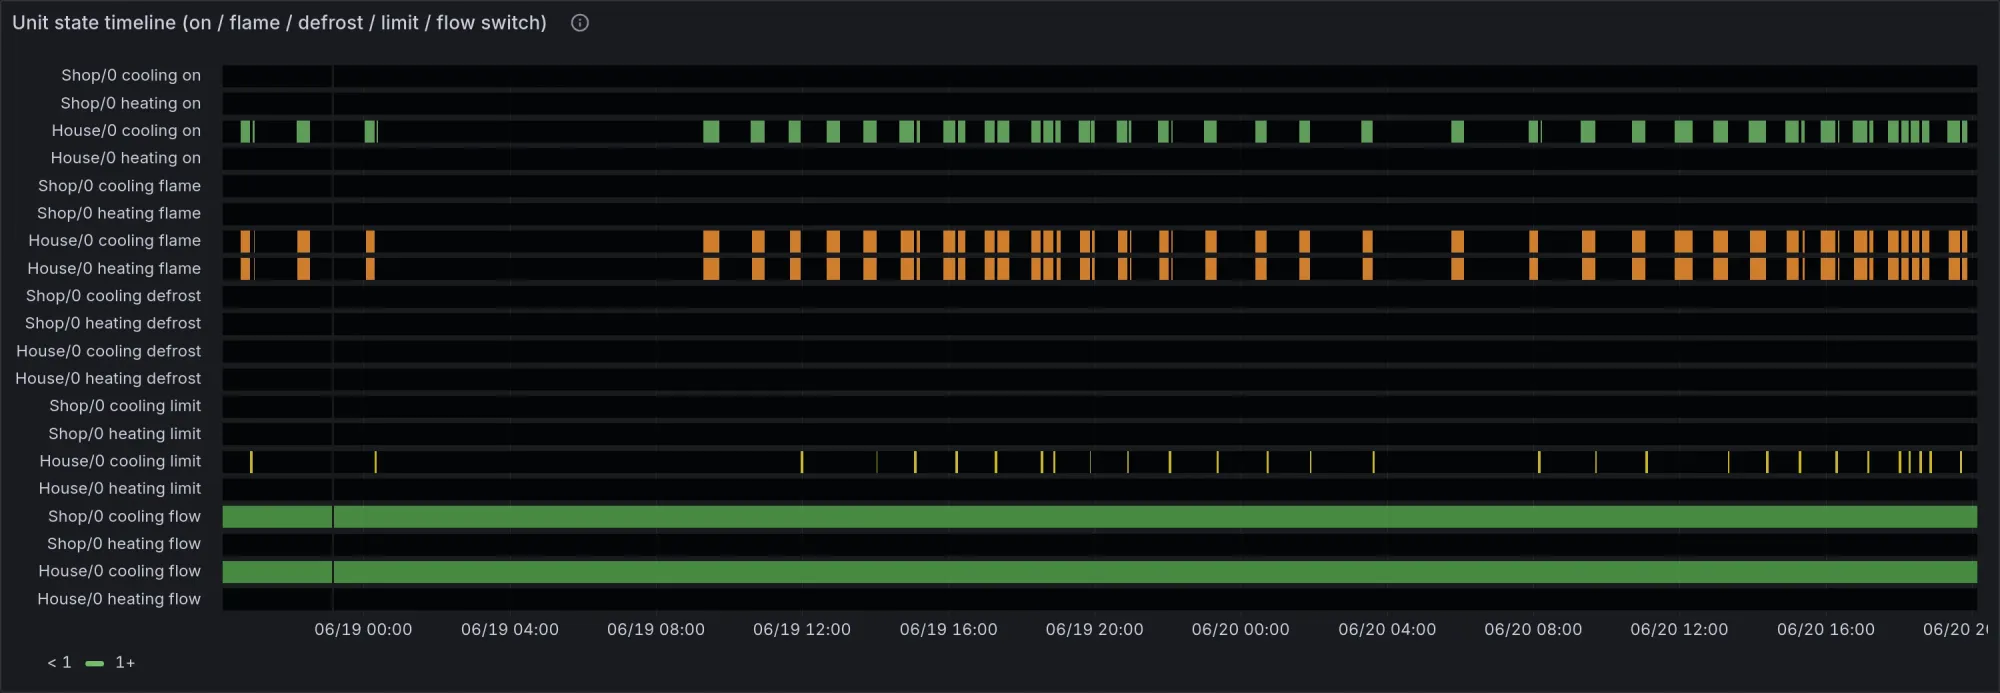
The unit detail is where the machine's character shows. A GAHP-AR is an on-off device; it does not modulate, it cycles. Watch the house machine's temperatures and you see it plainly: a sawtooth of hard climbs and drops as it fires, satisfies, and rests, with the solution pump pulsing on and off in lockstep. You cannot see that on a screen that updates once and shows you a single number. You can see it, and reason about it, when the machine has been talking for days.
The payoff: it warns me before the heat goes out
All of this would be a nice toy if it only drew pretty graphs. The reason it earns its place is one alert, and it is tangled up with another thing I own: the natural gas well on the property.
The farm runs on its own gas. It is good gas, but a low-deliverability well. Draw on it too hard and the pressure sags below a single psi and begins fouling the small orifices in the regulators. When supply pressure dips at the wrong moment, the heat pump tries to light, fails, retries, and after enough failed tries it throws a hard flame-lockout fault and shuts down cold. In January, in a house, that is not an abstraction.
But the controller counts those failed ignition retries, and it exposes the count. So there is a window: a soft warning that precedes the hard lockout by a few minutes. The alert I care about most watches that count and pings me the instant a machine starts struggling to light, before it gives up. The gear I already owned, reporting a number it was already keeping, now buys me the minutes to act before the heat goes out. That alone earns the whole project.
What it cost, and what it was really about
The hardware to do all of this came to somewhere around a hundred and thirty dollars: two little WiFi bridges, a few connectors, a length of Cat6. I powered the bridges from old phone wall-warts and a couple of six-inch micro-USB cords I had no other use for. No new sensors, because the sensors were already there. No cloud subscription, because it all runs on hardware I already had. The expensive ingredient was attention, not money.
And that is the point I keep coming back to. It is easy to solve every problem by buying the next device, the one with an app, the one that promises to finally make the thing you already own smart. But the thing you already own is often smarter than the interface it shows you. It was measuring all of this the entire time. Somebody just had to open the door, read what was already being said, and wire up a listener.
Two heat pumps that used to show me four numbers now tell me everything, watch themselves, and warn me before they fail. I did not buy a smarter machine. I started listening to the one I had.
Comments
// Comments are reviewed before appearing. No spam. No noise.