I wanted a coding model I fully control. Not a chat window, a real backend for an agentic coding tool, running on hardware I own. The payoff is the whole reason to bother: no code leaves the house, there is no per-token bill, it is fast, it works whether or not the internet does, and every machine on the LAN can point at one box. And since my network travels with me now, "on the LAN" reaches me just about anywhere I am. I had a gaming PC whose RTX 5090 sits mostly idle while I work, so I turned it into that box.
It works well now, and I use it every day. Getting there meant picking the right serving stack, making tool calls actually work, securing the endpoint, and sanding off a few rough edges that come with new Blackwell silicon and with running inside WSL. None of it was hard in hindsight, but almost none of it was obvious in the moment. This is the writeup I wish I had had the first time around.
The stack
RTX 5090 (32GB VRAM, Blackwell, CUDA compute capability sm_120), about 94GB host RAM, Windows 11 Pro, NVIDIA driver 596.x. The inference server is vLLM (torch 2.11, CUDA 13 wheels), running inside WSL2 (Ubuntu) as a systemd service out of a venv at /opt/vllm. The model is Qwen3-Coder-30B-A3B-Instruct in AWQ 4-bit. It is a Mixture-of-Experts: 30.5B total parameters but only 3.3B activated per token (128 experts, 8 active), which is why a "30B" model decodes as fast as it does. The AWQ 4-bit weights are roughly 16 to 18GB on disk depending on the quant, with KV cache and activations on top at runtime, so the whole thing lives comfortably on one 32GB card.
Why this model, and how much context fits
Two questions decide what you can run on a single 32GB card: which model, and how long a context. They are linked, because both draw from the same pool of VRAM.
On the model, Qwen3-Coder-30B-A3B was chosen for three reasons that all point back at the 5090. It is a Mixture-of-Experts, so only 3.3B of its 30.5B parameters fire per token, which means it decodes at small-model speed while reasoning with large-model breadth. It is a coding model built for agentic use, with tool calling as a first-class feature, which is the entire point here. And in AWQ 4-bit its weights are about 16 to 18GB, which leaves real room on a 32GB card for everything else. A dense 30B at similar quality would be slower per token; a 7B or 14B would fit with room to spare but give up too much capability. The 30B MoE is the spot where quality, speed, and memory all land on one card.
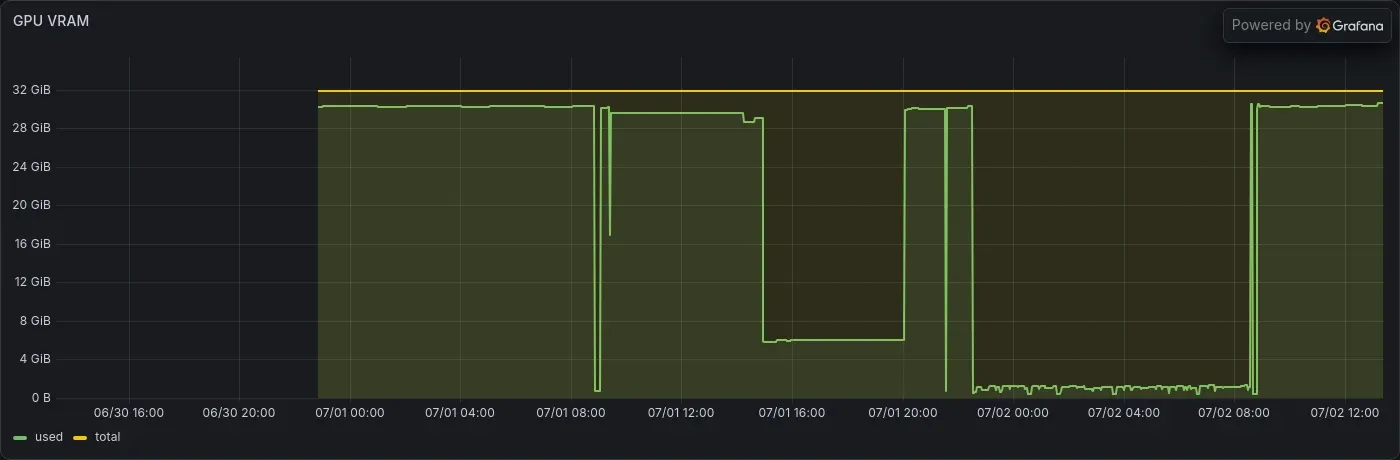
Context length is the other half of the memory budget, and it is the easy one to get wrong. The model can go far longer than I run it, but on a 32GB card the limit is not the model, it is the KV cache. Every token in the context keeps its attention keys and values in VRAM, and that cache grows linearly with context length. With --gpu-memory-utilization 0.90 I hand vLLM roughly 29GB; the weights take their ~17GB, a little goes to activations and overhead, and what is left becomes the KV cache pool. --max-model-len 114688, which is 112K tokens, is sized to fit that pool with headroom rather than to match the model's full advertised context, which would want far more KV cache than the card has once the weights are loaded. 112K is also plenty for coding: it holds a large file, its neighbors, and a long agent transcript without ever touching the ceiling. Push --max-model-len to the model's maximum and vLLM either refuses to start, because there is not enough VRAM for the KV cache, or it serves far fewer requests at once. The move is to size the context to the card, not to the model's spec sheet.
What I would try next is mostly about squeezing the same card harder. The 5090 has native FP8 and FP4 (NVFP4) support, and once the CUDA-graph situation on sm_120 is fully settled, an FP8 or NVFP4 build of a similar model is the obvious experiment: potentially faster and smaller than AWQ, which would free VRAM for either more context or a bigger model. A larger MoE that still fits in 4-bit on 32GB is worth a look if a strong one lands. And speculative decoding, pairing this model with a tiny draft model that proposes tokens the big model verifies in bulk, is the cheapest way to buy more tokens per second without changing the main model at all. For now the AWQ 30B is the daily driver and the rest is a list for a rainy weekend.
Why vLLM, and what went wrong with Ollama
The obvious first stop is Ollama. It is one command to install, it pulls a model and serves it, and it happily ran Qwen3-Coder for plain chat. If all I wanted was a local chatbot, I would have stopped there.
Agentic coding is not plain chat. It lives or dies on tool calls: the model has to reliably say "read this file," "apply this edit," "run this command," in a structured form the client can parse and execute. Through Ollama's OpenAI-compatible endpoint, that is exactly the part that fell apart for me. Tool calls came back malformed or empty often enough that the coding agent could not depend on them, and a coding backend that cannot call tools is not a coding backend. That, not speed, is why I moved off Ollama.
vLLM fixed it, for two reasons. First, it is a production-grade OpenAI-compatible server with real tool-call parsing built in. Second, it is much faster on this hardware, because it uses CUDA graphs and the Marlin AWQ kernels rather than a general-purpose runtime.
The tool-call detail is worth spelling out, because it is the thing that made agentic use actually work. Qwen3-Coder does not emit tool calls as OpenAI-style JSON. It emits them in an XML-flavored format of its own. vLLM's job is to translate that into the JSON tool_calls structure the client expects, and you have to tell it how:
--enable-auto-tool-choice --tool-call-parser qwen3_xmlqwen3_xml is the parser that reads the model's XML tool calls and hands the client clean JSON. There is also a qwen3_coder parser, but it has known bugs on long inputs, so prefer qwen3_xml. This one flag is the difference between a model that looks like it supports tools and one that actually does.
Wiring it into OpenCode
A quick clarification, because it tripped me up too. My coding agent is OpenCode. There is no special "OpenCode protocol" or "Claude protocol" to match. OpenCode, like most of these tools, talks to anything that speaks the OpenAI API shape, which is the de-facto standard for chat completions and tool calls. vLLM serves exactly that shape, an OpenAI-compatible HTTP API, so from OpenCode's side my local box looks like any other provider. "OpenAI-compatible" is the common language, not a vendor lock-in.
In practice that means adding a custom provider to opencode.json that points at the box and names the model:
{
  "provider": {
    "vllm": {
      "npm": "@ai-sdk/openai-compatible",
      "name": "Local vLLM",
      "options": {
        "baseURL": "http://<host-ip>:8000/v1",
        "apiKey": "<your key>"
      },
      "models": {
        "qwen3-coder": {
          "name": "Qwen3-Coder 30B AWQ",
          "tool_call": true,
          "limit": { "context": 114688, "output": 32768 }
        }
      }
    }
  },
  "model": "vllm/qwen3-coder"
}
tool_call: true is the switch that tells OpenCode this model can use tools; the qwen3_xml parser on the server side is what makes those tool calls well-formed when they arrive. Set the top-level model to vllm/qwen3-coder and OpenCode uses the box by default. Any other machine on the LAN gets the same treatment with the same three lines: base URL, key, model. Any other OpenAI-compatible client works the same way.
Locking it down with an API key
On the LAN is not the same as safe. An open inference endpoint is an open door to your GPU, and to whatever the model can be talked into doing. vLLM's OpenAI server takes an API key, so generate a strong one and use it:
openssl rand -hex 24Put that value in the server's environment as VLLM_API_KEY and in each client's apiKey field. One boundary is worth knowing: vLLM's --api-key only guards the paths under /v1, /v2, and /inference. Endpoints like /metrics, /health, and /tokenize stay open with no auth. That is convenient in one specific way, Prometheus can scrape /metrics without a token, but it means "I set an API key" is not the same as "the whole server is locked." If you ever expose this box past a trusted LAN, put a reverse proxy in front that allowlists only /v1 to the outside and keeps /metrics reachable to your scraper on the inside. And keep the key off the command line, where it leaks into ps and /proc; load it from an environment file instead.
The rough edges
Two things made this harder than it should have been. The RTX 5090 is brand-new Blackwell silicon (sm_120) that not every layer of the stack has fully caught up to, and vLLM runs inside WSL2, which has its own lifecycle quirks. Three problems cost me most of the time. Here is each one and its fix, because these are the parts that are genuinely hard to find answers for.
The silent hang on consumer Blackwell
vLLM started clean. It captured CUDA graphs, logged Application startup complete, bound :8000, and parked about 31GB in VRAM. Then every request hung. Not under load, not a concurrent burst: a plain curl to localhost from inside the same WSL distro. Twenty-second timeout, no traceback, no error line, nothing in the log. The process just sat there.

This is the consumer-Blackwell "silent engine hang." The community writeups on sm_120 describe the same thing: a silent deadlock with no crash and no log, where /health keeps returning 200, in-flight requests freeze, vllm:generation_tokens_total stops incrementing, and the GPU reads 100% utilization at a fraction of full power. Nobody has published an official root cause that I have found. The reports pin it on the CUDA-graph machinery for one simple reason: --enforce-eager makes it disappear.
Which is the trap, because --enforce-eager is the obvious fix and the wrong one. It works by turning CUDA graphs off entirely, and on this model that drops throughput to about 46 tok/s. For a Mixture-of-Experts that is a brutal trade, because the model fires many small per-expert kernels per token and CUDA graphs are what claw back the launch overhead. Eager mode is a debugging tool, not a config to ship.
The real fix is to keep CUDA graphs but stop capturing the one graph that deadlocks. vLLM's cudagraph_mode has five values:
NONE: graphs off, equivalent to--enforce-eagerPIECEWISE: graph-incompatible ops such as attention stay eager, everything else is capturedFULL: one full graph for all batchesFULL_DECODE_ONLY: full graph for uniform-decode batches, eager for prefill and mixedFULL_AND_PIECEWISE: full graph on the decode path plus piecewise for the rest, the general default
My working hypothesis is that a full graph on the decode path is what deadlocks on sm_120, and PIECEWISE sidesteps it by never capturing that graph while still capturing the compatible majority of the model. Since there is no published root cause, treat the mechanism as a guess. The result is not a guess. There is no --cudagraph-mode flag, so you set it through the compilation config:
--compilation-config '{"cudagraph_mode":"PIECEWISE"}'I found that by reading vllm serve --help=all, which dumps the nested config fields the normal help hides. On my box it is about 238 tok/s single-stream versus the 46 tok/s eager fallback. Treat those as my numbers on this exact hardware and quant, not a universal benchmark; the closest public figure I could find is around 194 to 197 tok/s for a similar MoE on a 5090. The one tax is a roughly 50-second torch.compile the first time it serves after each start, so I warm it with a curl at startup and no real request ever eats the compile. One caveat so you do not overgeneralize: the best-documented sm_120 hang is specific to an NVFP4 plus FlashInfer stack; I hit the same class of failure on AWQ, and PIECEWISE was the right move either way.
Mirrored networking and the wrong interface
To reach the box at the host's own IP from other machines, I set WSL to mirrored networking in %USERPROFILE%\.wslconfig:
[wsl2]
networkingMode=mirrored
This is the part I am least sure about, so let me be honest about it. I am not a Windows person. I fought my way through Hyper-V networking and its firewall half-understanding how any of it actually works, and I would not be shocked to learn I did something clumsy. Mirrored mode needs Windows 11 22H2 or newer, and the Hyper-V firewall blocks inbound by default, so you have to open it, either broadly or, better, per-port:
New-NetFirewallHyperVRule -Name "vLLM-8000" -DisplayName "vLLM 8000" -Direction Inbound -LocalPorts 8000 -Protocol TCP -Action AllowIf you know Windows networking better than I do and see where I went wrong, please leave a comment. I would genuinely rather learn the right way than keep cargo-culting the way that happened to work.
Because here is what actually broke. With mirrored mode on, vLLM stopped even loading weights and hung much earlier, at a log line like:
distributed_init_method=tcp://<lan-ip>:54641 backend=ncclvLLM stands up a torch.distributed coordinator even with a single GPU (tensor-parallel-size 1). To pick the address that coordinator advertises, it auto-detects a network interface, and under mirrored mode the interface it finds is the mirrored one, whose address is the shared LAN IP. The NCCL and Gloo socket bootstrap then tries to rendezvous over that interface and never completes. It is not a bind failure; it is the coordinator picking the wrong interface and hanging forever. The proof was clean: in NAT mode, where the interface is a private 172.x address, it worked; in mirrored mode it hung. One variable.
For a single box, all the "distributed" workers are in the same VM, so loopback is plenty for that coordination traffic. Pin the internal comms to loopback and leave the API bound wide:
Environment=VLLM_HOST_IP=127.0.0.1
Environment=NCCL_SOCKET_IFNAME=lo
Environment=GLOO_SOCKET_IFNAME=lo
and keep --host 0.0.0.0. This works because VLLM_HOST_IP and --host are independent: VLLM_HOST_IP sets the address for vLLM's internal distributed coordinator only, not the API server, so pinning it to 127.0.0.1 keeps the rendezvous on loopback while --host 0.0.0.0 still exposes the HTTP API to the LAN. NCCL_SOCKET_IFNAME=lo forces NCCL's socket bootstrap onto loopback, since it will not choose lo on its own, and GLOO_SOCKET_IFNAME=lo does the same for the CPU-side rendezvous.
Keeping the WSL instance alive
Once it served, the endpoint kept dropping. It worked while I had a terminal open and died a few seconds after I closed it. About 15 seconds after the last interactive wsl.exe session went away, the whole distro was torn down, equivalent to wsl --terminate, and vLLM went with it. A running systemd service does not keep the distro alive on its own.
Every thread online points at vmIdleTimeout, and that is the red herring, because WSL has two separate idle timers. vmIdleTimeout (under [wsl2]) governs the lightweight utility VM, and its clock only starts once every distro instance has already terminated. The instance itself has a different timer, which fires about 15 seconds after the last WSL process exits. So the instance dies first and vmIdleTimeout never even gets a chance to matter.
The fix is a second setting, in a different section, that most of the docs do not mention:
[wsl2]
networkingMode=mirrored
vmIdleTimeout=-1

[general]
instanceIdleTimeout=-1
The section header is the load-bearing detail: instanceIdleTimeout goes under [general], not [wsl2]. It was added in WSL 2.5.4, so you need a recent Store build, and -1 means never time out. Run wsl --shutdown once so the config is re-read, and after that the instance stays up with no terminal open. It is undocumented on Microsoft Learn as of mid-2026, so you will only find it in the GitHub issues and the WSL source.
The rest of the setup
Enable systemd in the distro so booting it starts your services, in /etc/wsl.conf:
[boot]
systemd=true
Then the whole thing is one systemd unit. The API key comes from an environment file, not the command line, and /usr/lib/wsl/lib is on PATH for reasons covered below:
# /etc/systemd/system/vllm.service
[Unit]
Description=vLLM Qwen3-Coder server
After=network-online.target
Wants=network-online.target

[Service]
Type=simple
EnvironmentFile=/etc/vllm/vllm.env
Environment=VLLM_HOST_IP=127.0.0.1
Environment=NCCL_SOCKET_IFNAME=lo
Environment=GLOO_SOCKET_IFNAME=lo
Environment=PATH=/opt/vllm/bin:/usr/lib/wsl/lib:/usr/local/sbin:/usr/local/bin:/usr/sbin:/usr/bin:/sbin:/bin
ExecStart=/opt/vllm/bin/vllm serve /opt/models/Qwen3-Coder-30B-A3B-Instruct-AWQ-4bit \
  --served-model-name qwen3-coder \
  --quantization awq_marlin \
  --gpu-memory-utilization 0.90 \
  --max-model-len 114688 \
  --compilation-config '{"cudagraph_mode":"PIECEWISE"}' \
  --enable-auto-tool-choice \
  --tool-call-parser qwen3_xml \
  --host 0.0.0.0 --port 8000
Restart=on-failure
RestartSec=5

[Install]
WantedBy=multi-user.target
A few notes on the flags. awq_marlin is the Marlin-accelerated AWQ path, which vLLM auto-selects for AWQ checkpoints on Ampere and newer, so the flag mostly confirms the fast path. --served-model-name qwen3-coder is the id clients send in the model field. --max-model-len 114688 caps prompt plus output at 112K tokens.
Two more operational notes. WSL does not start on Windows boot, so a Task Scheduler task set to run at startup, whether or not anyone is logged on, boots the distro (wsl.exe -d <distro> true), which starts systemd, which starts vLLM. Across a real cold reboot the host is back in about 45 seconds and the endpoint answers in about 90, with zero manual steps. And inside WSL, nvidia-smi lives at /usr/lib/wsl/lib, which is not on the default PATH; interactive shells get it from the login profile but a systemd service does not, so anything that shells out to nvidia-smi (a metrics exporter, a healthcheck) silently finds nothing unless that directory is on the unit's PATH. That is why it is in the unit above.
Watching it on one dashboard
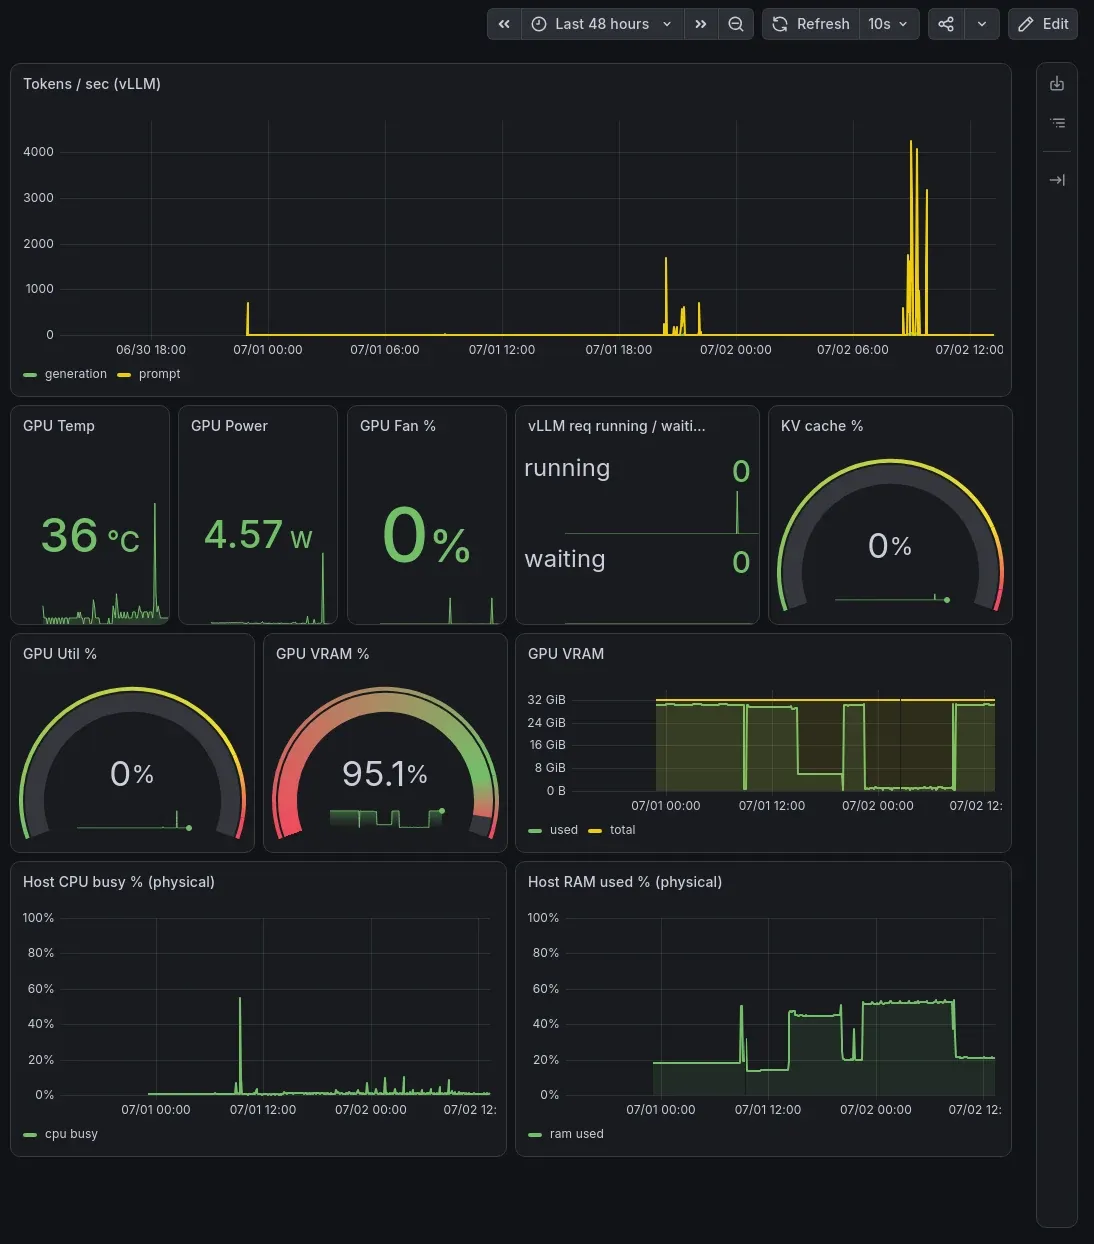
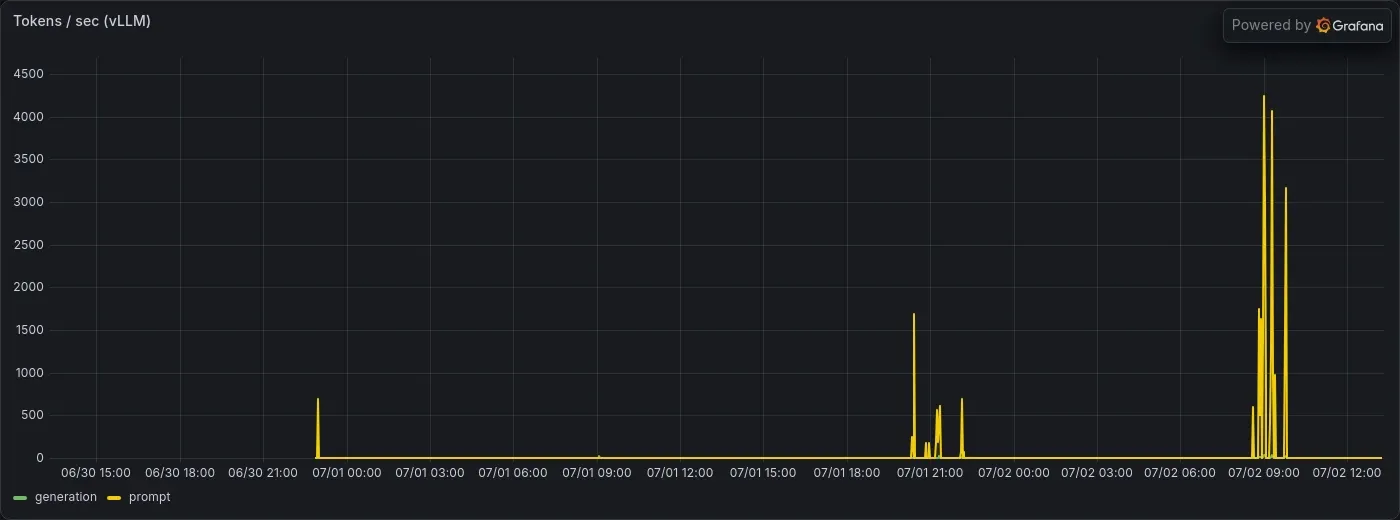
The last piece is being able to see what the box is doing. Prometheus scrapes three targets: vLLM's own /metrics (throughput as rate(vllm:generation_tokens_total[1m]), and KV cache pressure as vllm:kv_cache_usage_perc), an NVIDIA GPU exporter for temperature, power, VRAM, and utilization, and windows_exporter on the Windows host for true host CPU and RAM. That last one matters: a node_exporter inside WSL reports the utility VM's memory (about 46GB here), not the machine's 94GB, so for real host numbers you want the Windows exporter. Grafana pulls all of it into one view.
Why it was worth it
What I have now is a private coding model that lives on my own network. Every machine in the house points at one box, no code leaves the LAN, there is no per-token bill, it is fast enough to feel instant, and I can watch it work. The rough edges were a weekend of yak-shaving on new silicon and an unfamiliar OS, and the daily result is worth every hour of it.
If you take one thing from the rough edges, take this: in all three, the obvious fix was the wrong one. --enforce-eager for the hang, vmIdleTimeout for the teardown, the mirrored interface for the networking. The real fix was a specific setting a layer down. On brand-new silicon especially, change one variable at a time, get the actual error or timeout in hand before you name a cause, and read --help=all and the issue trackers before you reach for the blunt instrument. That, and the Windows networking, is where I would most welcome being told I did it wrong. The comment box is open.
Comments
// Comments are reviewed before appearing. No spam. No noise.