
The last build ended with everything on one screen. Every sensor, every camera, the heat pumps, the water tank, the network gear, all of it scraped into a self-hosted Prometheus and drawn on a single Grafana dashboard running on a small box on the LAN.
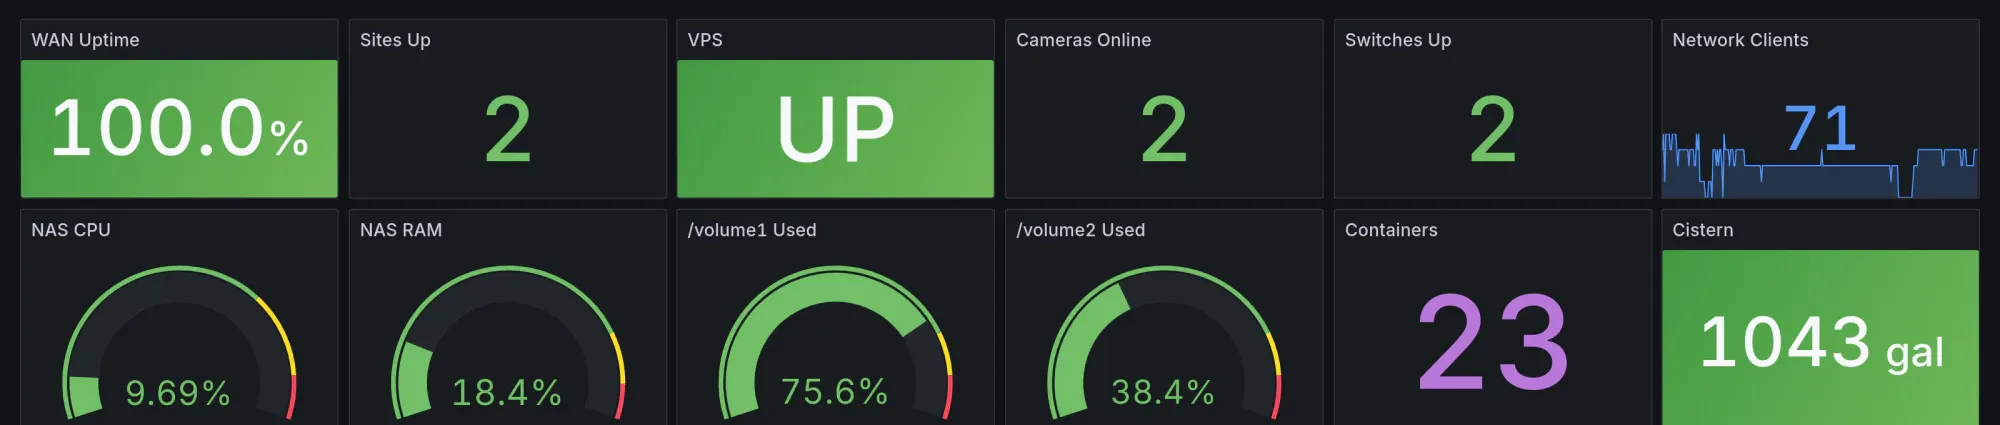
There was one catch. That screen only existed at home.
The dashboard lived at something like 10.0.0.5:3000, a private address that means nothing the moment you walk out the door. Leave for a few days and there is no way to check whether the heat actually kicked on, whether the cameras are still recording, whether the tank is filling or draining. The data was all being collected to a machine I could not reach.
So the project became a simple question: how do you look at a dashboard that lives on your LAN, from a phone, in a parking lot, without installing anything on the phone and without poking a hole in your home network.
The options that did not work
Port-forward Grafana. Open a port on the router, point it at the dashboard, done. Two problems. First, that puts your monitoring stack on the public internet, protected only by Grafana's own login. Second, the connection here sits behind CGNAT. The ISP hands out a shared address, so there is no inbound address to forward to. A lot of rural, cellular, and Starlink links are the same. The front door I would forward to does not exist.
VPN home. Stand up WireGuard or Tailscale, connect back to the LAN, browse to the dashboard over the tunnel. This works, and I use a VPN for plenty of things. But it asks something of every viewer: install a client, load a config, be on the mesh. You cannot hand someone a link. You cannot glance at it on a borrowed phone. For a dashboard I want to just open, that is friction in the wrong place.
Move Grafana to the cloud. This defeats the entire point of the last build. The whole exercise was to own the collection, on hardware I control, on the LAN. Shipping it off to a hosted service to solve the viewing problem trades away the thing I wanted to keep.
What I actually wanted was boring: open a normal https:// link, hit a login, see the dashboard. Nothing installed on the device. Nothing inbound opened at home. The data stays exactly where it is.
The shape of the answer
Put a small server with a real public IP out on the internet, and have the home network dial out to it through a tunnel. The internet only ever talks to that public server. The public server forwards approved, authenticated requests down the tunnel to the dashboard on the LAN. Home never accepts an inbound connection. It only ever makes outbound ones, which CGNAT is perfectly happy to allow.
The principle from the last build survives intact: collect on the LAN, present from anywhere. Grafana does not move. It stays exactly where it was, bound to the LAN, talking to nothing it did not talk to yesterday. We are only giving it a doorway, and the doorway lives somewhere else.
The piece that ties this together is Pangolin, a self-hosted tunneled reverse proxy built on WireGuard. It is a handful of cooperating parts:
- Pangolin itself: the dashboard and control plane, where you define what is exposed and who is allowed to reach it.
- Traefik: the reverse proxy that terminates TLS and routes requests. Pangolin drives it.
- Gerbil: manages the server side of the WireGuard tunnel on the VPS.
- Badger: a Traefik middleware that checks authentication before any request is allowed through.
- Newt: the small client that runs at home and dials out to form the tunnel.
I picked it over the hosted tunnel services for three reasons. It is self-hosted, so the front door is mine and not a third party's. It puts a login in front of each app at the proxy, so a plain browser works with nothing installed. And its model maps cleanly onto what I was already doing: a Site is a network you connect (home), a Resource is an app you expose (Grafana), and a Target is the actual internal address it points at.
How a request actually flows
Here is the full path of a single request:
Your browser
   |  https://grafana.example.com
   v
[ VPS, public IP ]    <- the only address the internet can see
   Traefik terminates TLS
   Badger checks you are logged in
   Gerbil hands the request to the WireGuard tunnel
   |
   |  WireGuard, an outbound tunnel opened from home
   v
[ Newt, running at home ]   <- dials OUT to the VPS, accepts nothing inbound
   |
   v
Grafana on the LAN, 10.0.0.5:3000   <- never exposed to the internet directly
DNS for grafana.example.com points at the VPS, which is the only public IP anywhere in the picture. Your home WAN address is never published. If someone scans your home connection they find nothing listening, because nothing is.
Building it
You need three things to start: a cheap VPS with a public IP, a domain, and access to that domain's DNS.
1. Stand up Pangolin on the VPS. The installer walks you through it:
curl -fsSL https://static.pangolin.net/get-installer.sh | bash
sudo ./installer
It asks which edition to install (Community is the free, self-hosted one), offers to install Docker if it is missing, then asks for your base domain, a dashboard subdomain, a Let's Encrypt email, and the first admin account. It brings up three containers: pangolin, gerbil, and traefik. Open 443 for web traffic and 80 for the certificate challenge, plus UDP 51820 for the tunnel. A couple of minutes later the dashboard is live at the subdomain you chose, with a valid certificate and your admin login already set.
2. Point DNS at it. One wildcard record, so every future subdomain just works:
*.example.com A <your-vps-ip>3. Connect home with Newt. In the Pangolin dashboard, create a Site and name it something like home. It hands you three values: an ID, a secret, and the server endpoint (the Pangolin URL itself, not a tunnel address). Drop them into a one-container compose file on a machine at home that has Docker and the Compose plugin:
services:
  newt:
    image: fosrl/newt
    restart: unless-stopped
    network_mode: host
    environment:
      PANGOLIN_ENDPOINT: "https://pangolin.example.com"
      NEWT_ID: "<generated-id>"
      NEWT_SECRET: "<generated-secret>"
Save it as compose.yml, run docker compose up -d, and within a few seconds the Site shows as connected. That is the tunnel. Notice what you did not do: no port forward, no firewall rule, no inbound anything. Newt reached out. The network_mode: host line lets Newt reach other machines on your LAN by their real IP, which is what the next step relies on.
4. Add Grafana as a Resource. Create a Resource on a subdomain, say grafana.example.com, and set its Target to the dashboard's real address on the LAN:
Target:  http://10.0.0.5:3000
Site:    home
Traefik requests a certificate, and the subdomain comes up over HTTPS. One thing worth knowing up front: point the Target at the host IP and port. Going by container name only works if Newt shares a Docker network with that container, and the quiet failure when it does not is a 502 that looks exactly like a correct config. Because this Newt runs with network_mode: host it is not on a Docker bridge network at all, so container-name targets cannot resolve. Host IP and port sidesteps the whole question.
5. Put a lock on it. A Resource with no auth is just your dashboard on the open internet. In the Resource settings, turn on authentication. Pangolin can require a logged-in platform user (its own SSO), a shared password, a PIN, an email allowlist, or a real identity provider over OIDC. With it on, any unauthenticated request to grafana.example.com is bounced to the Pangolin login before it ever touches the tunnel.
Now test it from somewhere that is not your house. Cellular data, a coffee shop, anywhere off the LAN. Open the subdomain, log in, and there is the dashboard.
What I would tell myself starting over
- Keep Grafana LAN-only. The tunnel is its only way in. Do not also port-forward it "just in case." The entire security story rests on the public server being the single front door.
- Two locks beat one. Pangolin's login in front, Grafana's own login behind, and turn off Grafana's anonymous access. If you ever wire Pangolin to pass an identity header straight into Grafana, only do it when Grafana is reachable exclusively through the proxy, because a trusted header is forgeable by anyone who can reach Grafana directly.
- Use a wildcard certificate. Switching certificate issuance to a DNS challenge gets you one
*.example.comcert covering every subdomain, makes each new Resource instant, and lets you stop exposing port 80 altogether. - Shrink the audience before the login even loads. Pangolin can gate a Resource by IP range, by country, or by network operator. If only you and a couple of known networks ever need in, say so, and most of the internet never even sees the login page. Add CrowdSec on top if you want reputation-based blocking.
- If a certificate will not issue, check DNS first. The usual cause is the proxy trying to validate a subdomain before its DNS record has propagated. Make sure the name resolves on the public resolvers, then restart the proxy so it retries.
Where it leaves things
Every dashboard from the last build is now a link. The heat pumps, the cameras, the tank, the network, all of it, behind a login, openable from a phone in a parking lot. The home network never opened a port. The data still lives on the same box on the LAN it always did. The only thing that changed is that there is now a doorway to it, sitting on a server out on the internet, that knows how to ask who you are before it lets you in.
Comments
// Comments are reviewed before appearing. No spam. No noise.